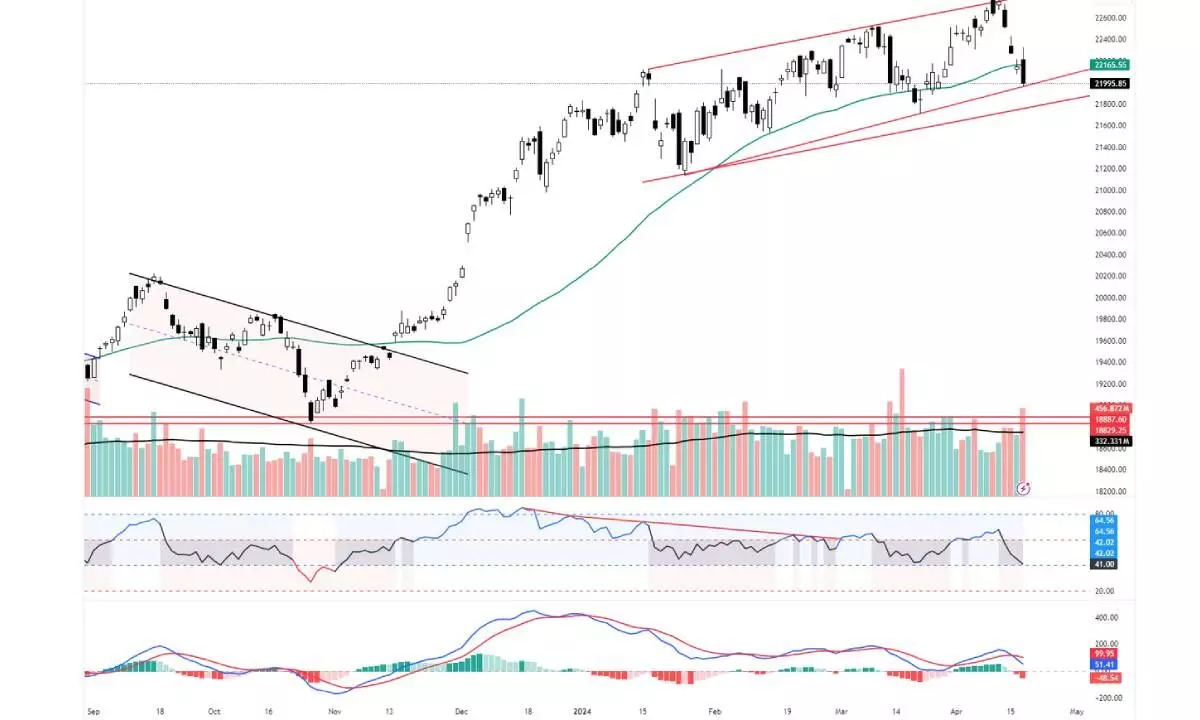
Weekly Bollinger bands contracting sharply
Continue the bearish positions with strict risk management and hedging. The index formed a strongest bearish bar and a bearish engulfing candle
image for illustrative purpose

The positive opening was sustained with a broader market selling pressure. The Nifty declined by 152.05 points or 0.69 per cent and closed at 21995.85. Only the Media index closed positively with a 0.77 per cent gain. The CPSE and PSE indices were the top losers, with 1.53 per cent and 1.26 per cent. The Oil and Gas and FMCG indices are down by 1.10 per cent and 1.08 per cent, respectively. A majority of sectoral indices declined by 0.50 per cent to 0.95 per cent. The India VIX is up by 3.37 per cent to 13.04. The market breadth is neutral at 1:1, as 1329 advances and 1307 declines. About 161 stocks hit a new 127-week high and 161 stocks traded in the upper circuit. Infosys, JioFin, Reliance, and HDFC Bank were the top trading counters on Thursday, in terms of value.
The Nifty registered a fresh distribution day, as it declined by over 0.60 per cent and had the highest and above-average volume. The highest Volumes were recorded after 15th March. It opened above at the prior day’s high and above the 50 DMA and 50 EMA. But, the selling pressure in the afternoon session erased all the initial gains. The index has closed below the 61.8 per cent retracement level of the prior swing. It also closed 0.82 per cent below the 50DMA. It also formed the strongest bearish bar and a bearish engulfing candle. As the index is almost at the four-week low, It has given a strong, weaker signal. The RSI is just on the 40 support. The MACD shows an increase in bearish momentum. The most positive advance-decline ratio at opening ended as negative. As we expected, the volatility has increased. The daily range has increased to 365 points, and formed an outside bar. The index has filled Tuesday’s gap, as we expected earlier. On Thursday, the index has tested the rising trendline and bounced in the last 15 minutes. This bounce is mainly because of expiry trades. The weekly Bollinger bands are contracting sharply, and the 20-week average is at 21913. If the index fails to take support at this level, expect the testing of the previous low. For now, avoid the long positions as long as the index trades below Thursday’s high of 22326 and the 20DMA of 22282. On the downside, It may take support at a 20-week average of Rs21913. Continue the bearish positions with strict risk management and hedging.
(The author is Chief Mentor, Indus School of Technical Analysis, Financial Journalist, Technical Analyst, Trainer and Family Fund Manager)

