Technical indicators signal positive bias
It is advised not to have an aggressive position size. Focus on the leading sectors and the stocks that have broken out of their bases
Technical indicators signal positive bias

RRG charts show that the Pharma index entered into the leading quadrant with an increased relative strength and momentum. The Auto, Consumption, Healthcare and Metal sectors are also in the leading quadrant and may outperform the broader market index Nifty 500
The benchmark index extended the gains for the second successive week. The Nifty gained 373 points or 1.51 per cent last week. The BSE Sensex is also up by 1.48 per cent. The Midcap-100 and Smallcap-100 advanced by 2.02 per cent and 1.90 per cent, respectively. All the sectoral indices closed with gains. The Nifty IT is the top gainer, with a 4.26 per cent increase. The Metal and Auto indices were up by 2.09 per cent and 2.07 per cent, respectively. The Pharma, Energy, FinNifty, Realty, and Bank Nifty also posted decent gains. The India VIX is at its lowest level at 10.12. The FIIs sold Rs.9,245.27 crore, and the DIIs bought Rs.27,147.32 crore in August. The Nifty registered eight successive positive closings. It closed near the prior swing high and completed the formation right shoulder in a complex head and shoulders pattern. There are at least three gaps in the last week. Interestingly, this positive bias has not attracted the volumes. The rally on a declining volume is a surprising one and less trustworthy. The previous six days of volume have been much below the average volume. On Friday, the index formed an evening star candle, which is a sign of exhaustion. In any case, a gap-down opening and a negative closing will signal the reversal.
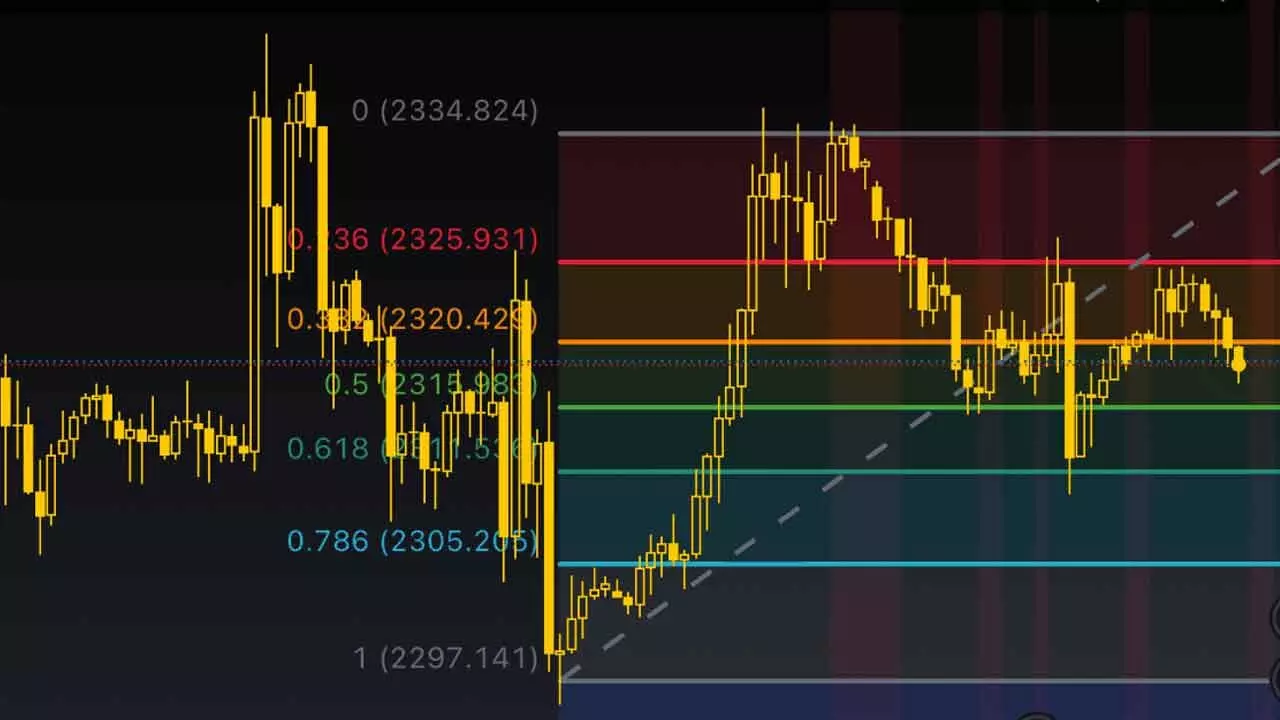
On a weekly chart, the Nifty closed above the 10 and 20 weekly averages. The Bollinger Bands began to contract. The index closed above the 50 per cent retracement level of the prior six-week downtrend. The 61.8 per cent retracement level is at 25164, which is the immediate target and a strong resistance. Normally, counter-trend rallies end at these retracement levels. If we look at the extension levels, the index is still below the 23.6 retracement level of the prior swings, which is at 25273. In other words, the 25164-273 is going to a stronger resistance zone. Importantly, the VIX is at its lowest levels. All the big crashes like 2000, 2008, and 2020 happened when the VIX was at around 10. Currently, the VIX is at 10.12. A two-point rise in VIX will result in a significant fall in the Nifty as it has an inverse relationship. At the same time, the swing may not extend beyond 8-13 days. The Federal Reserve is also meeting next week, which is an event risk for the markets.
Next week, the benchmark index, which starts with a neutral to positive bias, may face resistance at 25155-164. The event-driven sentiments may influence the price. Primarily, the index may consolidate in a tight range below 25273.
The daily RSI shifted its range into the bullish zone, and the weekly RSI (56.99) is nearing the bullish zone. The daily MACD line is above the zero line, and the histogram shows increased momentum. There are no negative divergences visible in all time frames. As the index gained 734 points from the 29th August low, all the indicators will show a bullish bias. The Relative Rotation Graphs (RRG) charts show that the Pharma index entered into the leading quadrant with an increased relative strength and momentum. The Auto, Consumption, Healthcare and Metal sectors are also in the leading quadrant and may outperform the broader market index Nifty 500. The IT and FMCG sector indices are showing strength and are improving buying opportunities. We may get some buying opportunities in these sectors. All other sectors are losing their relative strength and momentum; avoid them for now. In brief, the market structure has reached a mature stage and is approaching the resistance zone. The event-driven sentiment will dominate the market next week. Any spike in volatility may spoil the bullish bias and result in a sharp decline. It is advised not to have an aggressive position size. Focus on the leading sectors and the stocks that have broken out of their bases.
(The author is partner, Wealocity Analytics, Sebi-registered research analyst, chief mentor, Indus School of Technical Analysis, financial journalist, technical analyst and trainer)

