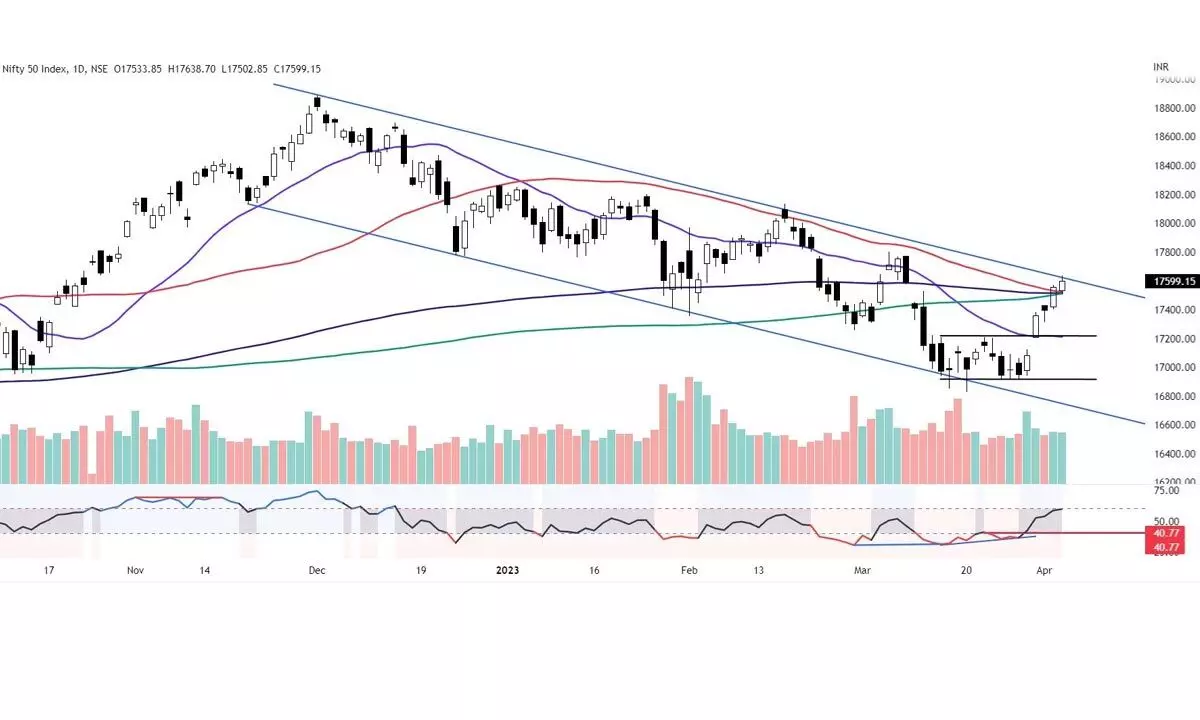
Charts indicating caution alert
Relative Strength Index (RSI) is still below the strong bullish zone (above 60); After the December 14, it sustained below the 60 zone; MACD line is still below the zero line on daily and weekly charts; India VIX at the lowest level in recent history; A spike in the VIX will hurt the uptrend
image for illustrative purpose

The domestic benchmark indices rallied for five successive sessions and closed just below the psychological level of 17,600 points. In a truncated week of three trading sessions, NSE Nifty gained 237.6 points or 1.37 per cent. BSE Sensex was up by 1.43 per cent. The broader market indices- Nifty Midcap-100 and Smallcap-100 rose 1.06 per cent and 2.26 per cent, respectively. All the sectoral indices closed higher. The Nifty Realty index is the top gainer with 4.3 per cent. Interestingly, In the last three sessions, FIIs turned buyers with Rs1,604.56 crore and the DIIs sold Rs2,272.53 crore.
The Nifty closed positively for a second successive week. With a long weekend, the traders were cautious in the last two hours on Friday. The index closed at the sloping trendline resistance. The last four days of the rally with lower volume. Currently, the index is closed above the 200DMA, 200DMA and 50DMA. The index met the measured target of double bottom pattern breakout. It filled the 10th March gap. The price structure does not show any weakness.
But there are several concerns about ongoing trends. The low volume in the last three days is a matter of concern. Even though the Nifty is 2.26 per cent above the 20DMA and 0.44 per cent above the 50DMA, both moving averages are in the downtrend. The index has retraced and faced resistance at the 38.2 per cent retracement level of the prior downtrend since December 2022. The index has bounced 725 points from the recent low in just five days. Normally, all the impulse moves will attract counter-trend consolidations. Let us wait for that.
As stated in the previous columns, the index is in the process of forming the right shoulder. The left shoulder’s top is at 18,114 and formed in 10 weeks’ time. Before making a high at 18,114 points, it dipped for three days and made a high in another two days. On a closing basis, the shoulder’s height is at 17,758 and 17,833 points. If history repeats, the right Shoulder Top may form in the next 3-5 days of time. After that decline, it may be sharper. In any case, the Nifty opens with a big gap up, and the upside potential is limited.
The Relative Strength Index (RSI) is still below the strong bullish zone (above 60). After the December 14, it sustained below the 60 zone. The MACD line is still below the zero line on daily and weekly charts.
After a massive rally of 5.75 per cent in the Dow Jones index, it formed inside bars for the last three days. The S&P 500 and Nasdaq have formed indecisive candles on the weekly chart. On the contrary, the Dollar index has been rising for the last four days. The CBOE Volatility Index VIX is also at its lowest level in recent times. Indecision and low volatility are not good for trending markets.
The India VIX is at the lowest level in recent history. The VIX and the benchmark index have an inverse relationship. All the tops were made at the lowest VIX levels. A spike in the VIX will hurt the uptrend. In the recent history, Jan-Feb 2020, VIX levels are at the 10.5 - 12 zone. Even in the recent swing high, the VIX is around 12. So, keep an eye on VIX levels for the next two weeks. Any small spike also will hurt the trend due to aggressive profit booking. Almost all the sectors are losing their relative strength and momentum. For the next two weeks, keep risk management as the top priority in trading decisions, and keep exposures at modest levels, adopt a cautious outlook.
(The author is Chief Mentor, Indus School of Technical Analysis, Financial Journalist, Technical Analyst, Trainer and Family Fund Manager)

