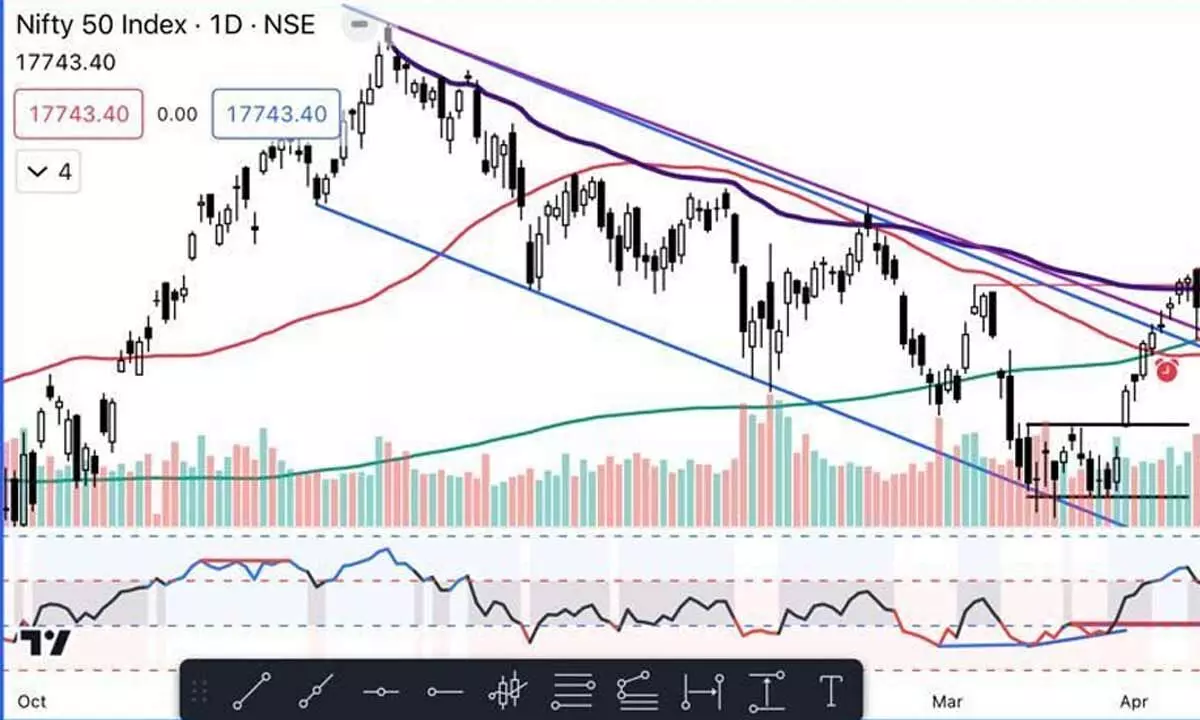
Charts indicate moderate bullish bias
Better to focus on stocks than indices; RSI entered into a strong bullish zone again; The momentum is below the 100 zone and the Relative Strength is declining
image for illustrative purpose

The domestic market came out of the last week’s indecision. The frontline index Nifty gained by 119.35 points or 0.68 points and closed at 17,743.40 points. The FinNifty and the Bank Nifty were the top gainers with 1.28 per cent and 1.23 per cent, respectively. PSU Bank index was driving the sector as it gained by 2.61 per cent. The Nifty IT is up by 0.71 per cent, and FMCG gained by 0.59 per cent. The Nifty Infra and Metal indices gained by 0.45 per cent each. Nifty Media index is down by 1.31 per cent and Pharma declined by 0.73 per cent. The advance-decline ratio is at 1.22. About 50 stocks hit a new 52-week high, and 77 stocks traded in the lower circuit. HDFC Bank, ICICI Bank and Axis Bank were the top trading counters today in terms of value.
The Banks and Financial Services stocks helped the Nifty rally above the three-day high. Soon after opening, the Nifty declined sharply and tested the 200DMA support again. The 200DMA acted as a support for the fifth time in six days. As it erased the tight range indecisiveness and closed at the day's high shows that the bulls are back in control. The volume was also higher in three days. It reached near anchored VWAP resistance (17775). A close above this will confirm the resumption of an uptrend. The week’s high is at 17,863 points, which is the next level of resistance. The previous breakout level is at 17,800 points. This zone of 17,775-17,863 will be tested for the bulls to cross. Today, the Nifty has faced resistance at the 61.8 per cent retracement level of last Monday’s move. If it closes above the 17,775 points, we can get an early confirmation for an upswing. The RSI entered into a strong bullish zone again. The Momentum is below the 100 zone, and the Relative Strength is declining in RRG charts, which is a worry. The rollovers are crucial for the trend as the monthly expiry is nearing. It is better to focus on stocks than the indices.
(The author is Chief Mentor, Indus School of Technical Analysis, Financial Journalist, Technical Analyst, Trainer and Family Fund Manager)

