Sensex may see further upside
The index formed long bullish candle on weekly chart, indicating an up move up to 62,800; On the flip side, below 62,000 traders may prefer to exit from long positions
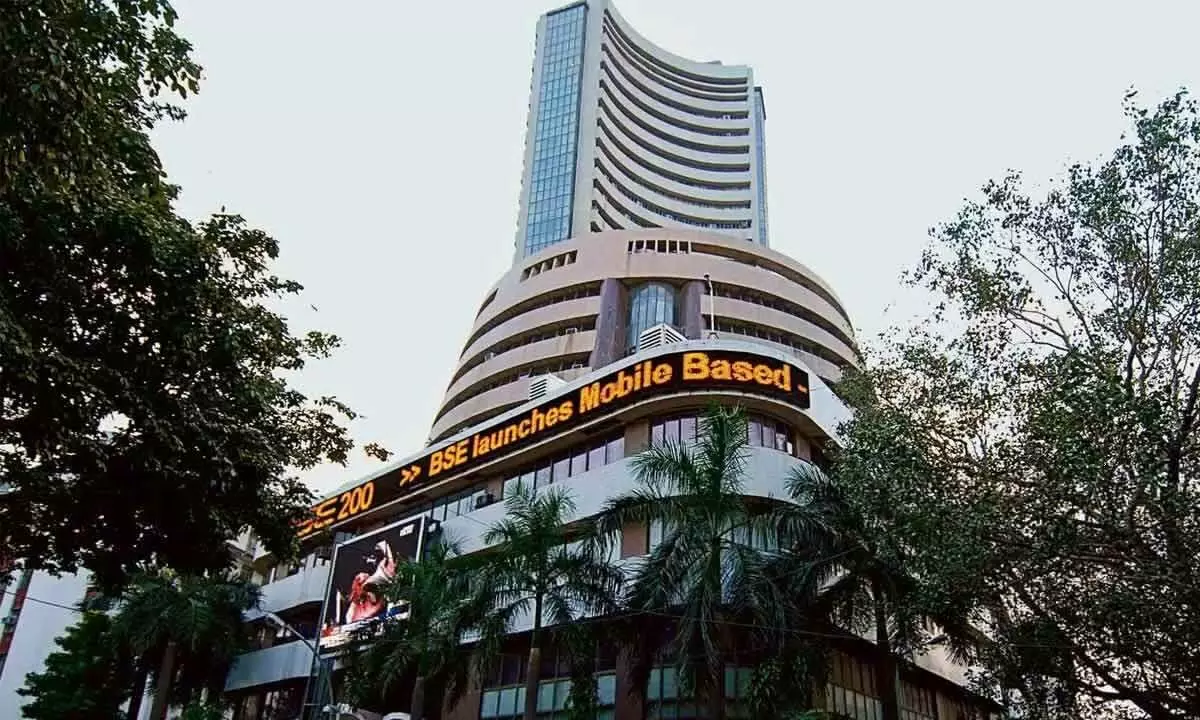
image for illustrative purpose

Mumbai: In the last week, the benchmark indices bounced back sharply. The NSE Nifty ended 1.6 per cent higher, while BSE Sensex rallied over 775 points. Among sectors, almost all the major sectoral indices were traded in the green, but metal index outperformed, rallying over 5 per cent.
Technically, one more time the index took the support near 20-day SMA (Simple Moving Average) and bounced back sharply. It also formed higher bottom formation on daily and intraday charts which is broadly positive. In addition, the index has formed long bullish candle on weekly chart that also supports further uptrend from the current levels.
“We are of the view that, the short term market texture is robust. For the trend following traders now, 62,000 would be the trend decider level. Above which, the index could move up till 62,800. Further upside may also continue which could lift the index till 63,000,” said Amol Agrawal of Kotak. On the flip side, below 62,000 traders may prefer to exit from trading the long positions. Below the same, the index could retest 61,700-61,600. For Bank Nifty traders, 20 day SMA or 43,600 would be the sacrosanct support zone, above which it could rally till 44,500-44,700. On the other side, below 43,600 the selling pressure is likely to accelerate. Below which, it could retest the level of 43,400-43,000.

