No adverse impact of Covid 2.0 on markets
Technical parameters show bullish price structure after a prolonged consolidation
image for illustrative purpose

The market had an extraordinary rally during the last week as the broader market strengthened further. After the February, it witnessed one of the biggest weekly gain. The defensive sectors playing a key role in bull dominance, the banks turned the leaders in the last week's market rally.
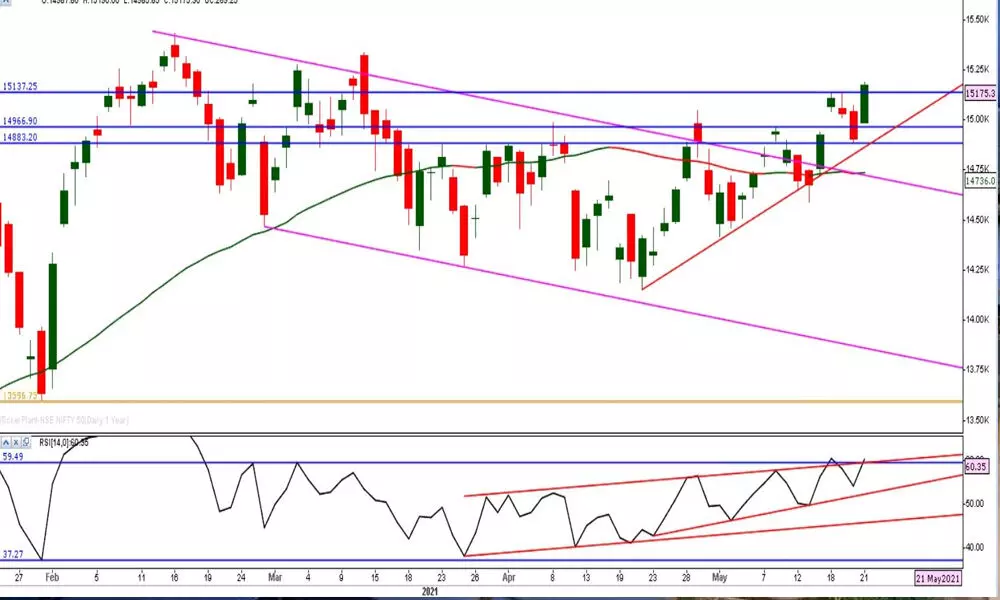
The Nifty gained 497.50 points or 3.39 per cent and settled at 15,175.3 during the last week. The BSE Sensex up by 3.7 per cent. The broader market indices out-performed as the Nifty Midcap-100 and Smallcap-100 advanced by 4.3 per cent and 3.8 per cent. The much broader index, Nifty-500 closed at new lifetime high with a 3.57 per cent gain last week.
The Bank Nifty was the top gainer with 7.6 per cent and followed by FinNifty and realty with 6 per cent gains. Only FMCG index declined by 0.3 per cent. During the last, the market breadth is mostly positive. FIIs sold Rs 4,009.74 crore worth of equities last week, and the DIIs bought Rs 1,318.52 crore.
The Indian stock market is discounting all the negative factors, unlike in March 2020. When the nationwide lockdown announced, the market actually made a bottom and bounced. This time, the market has formed a base since February 26, when the second wave of Covid-19 has begun.
Since then, the market moved in a broader range of 15,044-14,150 zone. The price moved in a sloping channel, but it also formed parallel highs at 14,800-15,000 zone. In one way, the pandemic conditions did not impact the market direction much. During the last week, it has decisively broken out of the broader range. In fact, it registered a strong breakout on Tuesday with a big gap up, and after two days retracement, it has decisive cleared all the resistances in consolidation zone.
As long as the Nifty sustains this breakout, the market will see new highs. This 39-day flat base also looks like an inverted head and shoulders, which is bullish. It has also broken out of an ascending triangle. These two pattern breakouts will result in a sharper upside move most of the time. In fact, there is very decent and technically sound cup formation is visible. The benchmark index is 2.98 per cent above the 50DMA and 2.72 per cent above the 20DMA. During the entire flat base zone, the 50DMA, is flattened. The index has oscillated around the 50DMA, 100DMA worked strong support. Since April 12, the Nifty took support at this medium-term average. Even the Bollinger bands turned up.
In normal conditions, the breakout is very powerful, as it followed by a strong base. Except for 3-4 days, the Nifty traded mostly in or above the Ichimoku cloud. It hardly fell eight per cent from the lifetime high. The RSI never went into an oversold condition. The during the last 62 days, the daily cash volumes are declining. But, on Friday, the volumes are above the average. After the April 22 low, the index has formed higher lows and higher highs. The trend strength indicator, ADX, declining during this period and indicated the bearish strength weakened.
The positive directional indicator +DMI is almost near the February 16 high. But the concern is even after the price moved higher, the +DMI is in fact declined. Importantly, the leading indicator, RSI moved out of the rising channel and above the prior swing highs. This is move negated the negative divergence's bearish implications.
The above technical parameters all are showing the solid bullish price structure after a prolonged consolidation. As it is above, the 50DMA and less number of distribution days (3) are the positive signs. Only in case of a decline below the 50DMA and the addition of distribution days will change the market structure into a neutral again. Without trying to predict the future price action and decoding future implications, it is better to be with a positive bias as long as Nifty trades above the 50DMA (14,736) and 14,880 zone. In the bear case scenario, the Nifty closes below the 14,880, which will be a fourth failed breakout. In short, the support zone for the market is 14,736-14,880 and the resistance zone at 15,336-15,431 zone. These levels are very important for the next two weeks.
(The author is financial journalist, technical analyst, family fund manager)

