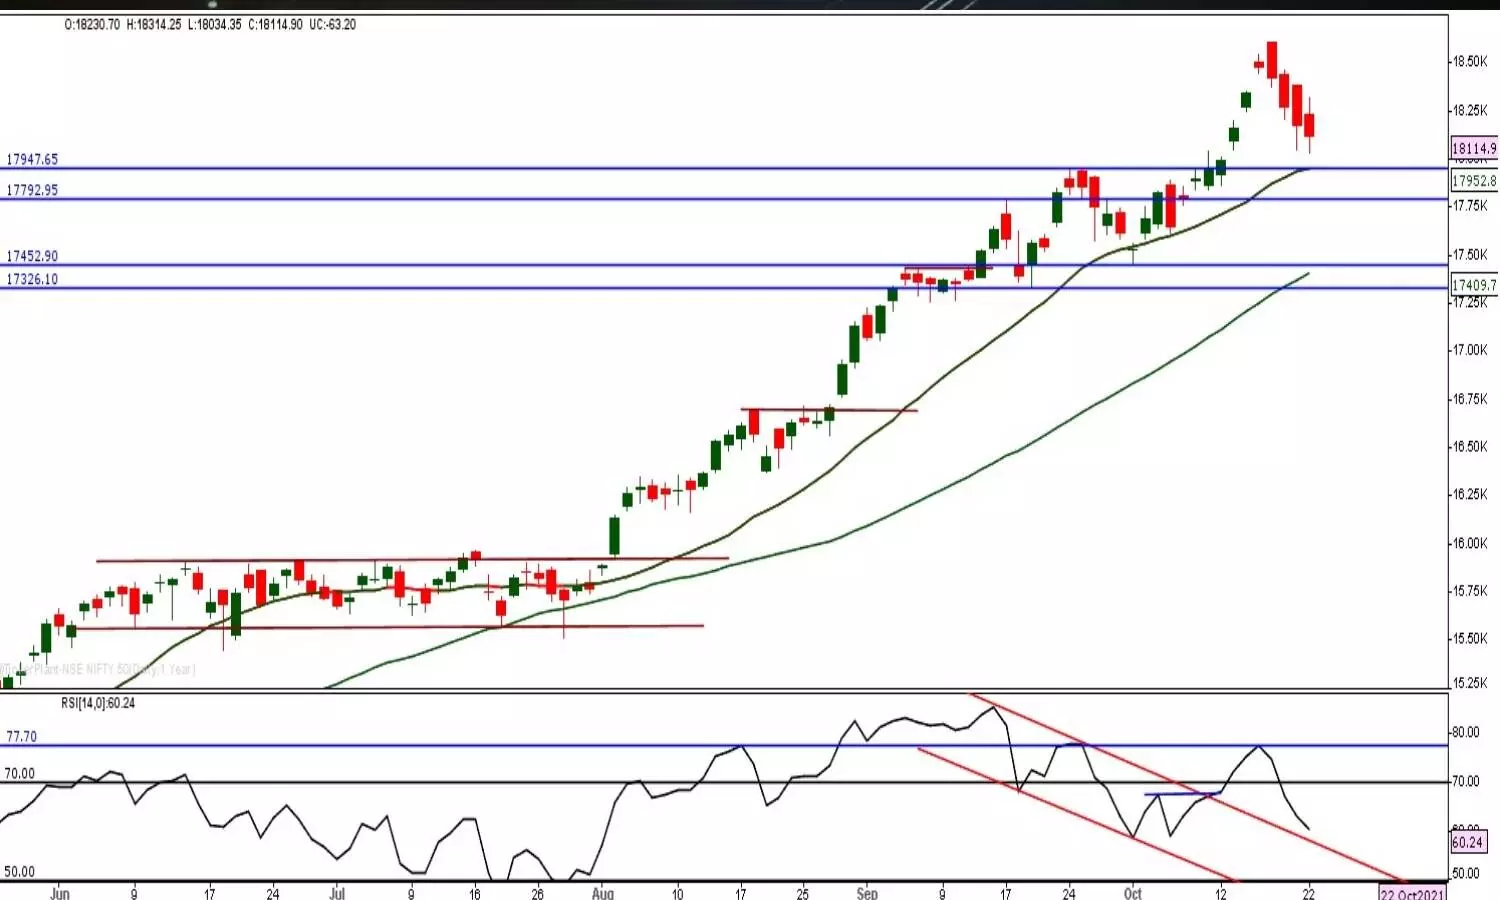
Nifty set to test 18,474 level, prev high
Barring Banknifty and Realty indices, all the sectoral indices were down
image for illustrative purpose

The equity benchmark indices are down as the selling pressure is mounting across the sectors. The Nifty ended with a 63.20 points loss at 18,114.90. During the last five trading sessions, it was down by 223.60 points or 1.22 per cent. The Midcap-100 and Smallcap-100 indices were down by 4.37 per cent and 5.36 per cent during the week. But, from their weekly high, they declined more than 7 per cent.
Barring Banknifty and Realty indices, all the sectoral indices were down on Friday. The Banknifty went up by 0.73 per cent, and the Realty index advanced by 2.56 per cent. The nifty Metal index declined the most, 3.04 per cent followed by the Media index down by 2.24 per cent. Nifty Pharma, IT, FMCG and Auto indices fell by 1 to 1.5 per cent. The overall market breadth is negative as 1,252 advances and 715 declines. About 50 stocks hit a new 52 week high. 100 stocks traded in the upper circuit and another 100 traded in the lower circuit today.
The Nifty registered a fourth consecutive decline during the week. It has formed a dark cloud cover on a weekly chart, which is bearish. As we expected, our target of 18,028 is almost met. The Nifty retraced 50 per cent of the prior upswing. It took support at VWAP, Anchored on October 1. The 20DMA and the prior breakout is at the same level of 17,952. The Anchored VWAP is at 18,041. Unless this 17,952-18,041 zone breaches on a closing basis, the market has very limited downside probability. Next, we can see some bounce if the index sustains above 17,952. As we are entering into a monthly derivative expiry week, the market may see impulsive moves on an intraday basis.
The RSI negative divergence is developing on the weekly chart. In any case, RSI closed below 70 zone on a weekly basis, and we can assume that the Nifty has made an intermediate top at 18604. On a daily chart, RSI requires to hold the 55 zone. A bounce above 18,306 is positive, and it can test 18,474 and the previous high.
(The author is Financial Journalist, Technical Analyst, Family Fund Manager)

