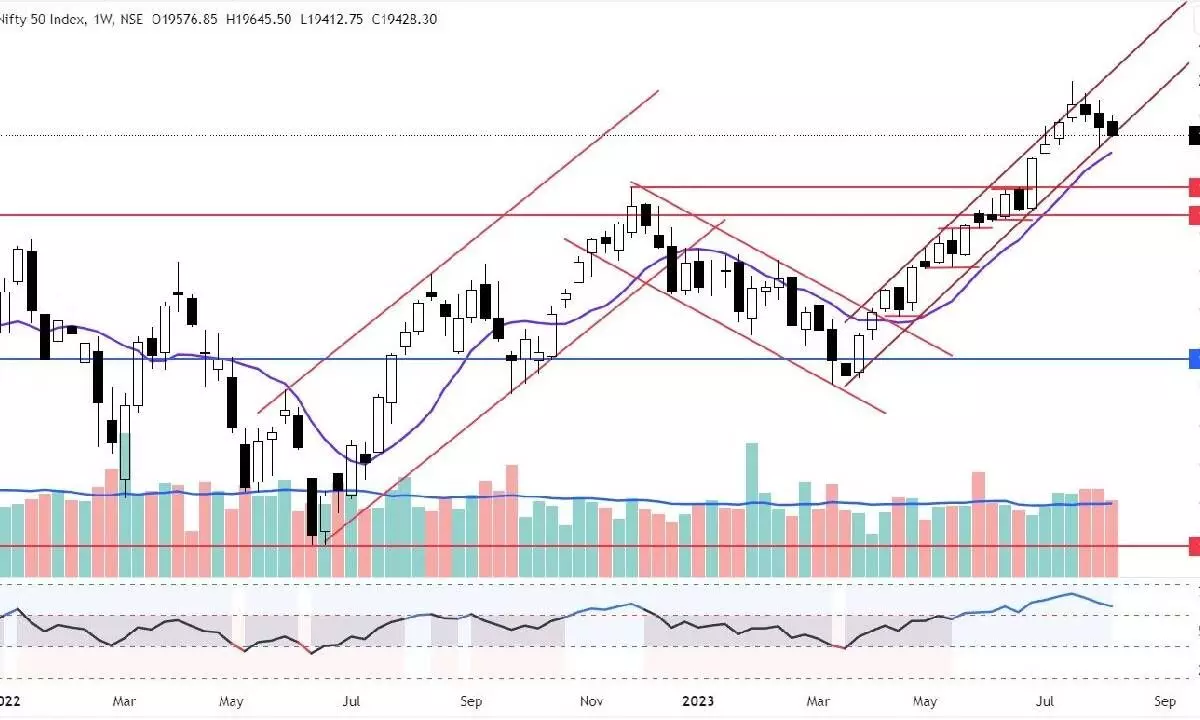
Nifty may begin this week on flat note
On daily charts, the index has formed lower highs and lows, which indicates short-term negative; various indicators like RSU and MACD line shows an increased bearish momentum
image for illustrative purpose

NSE Nifty declined for the third straight week in a narrow-range trading. With the renewed selling pressure from FIIs, the equities closed negatively. The Benchmark index, Nifty, ended with 88.70 points or 0.45 per cent decline after trading in the 232.75 points range. The BSE Sensex declined by 0.61 per cent. The Nifty Midcap-100 and Smallcap-100 indices outperformed, as they gained by 0.55 per cent, and 0.43 per cent, respectively. On the sectoral front, the Nifty Media and PSU Bank indices gained by 7.46 per cent and 3.09 per cent. The volatility has been increasing consistently for the last two weeks. The India VIX is up by 8.92 per cent to 11.52, indicating a weaker market ahead. The FIIs sold Rs7,546.53 crore, and the DIIs bought Rs5,353.56 crore worth of equities.
The Nifty has formed an inside bar after trading in a tight range last week. It closed below the crucial short-term supports. The index decisively closed below the rising channel. As we discussed earlier, after completing the mean reversion, the Bollinger bands contract. If this is both Bollinger bands, turns are a clear warning signal. The prior major low is at 19,300 points, which acted as support thrice earlier. And the 50DMA is at 19,240 points. This 19,240-300 support zone is like a lifeline for the market direction. The Nifty is already holding five distribution days. In any case, the index declines below 50DMA, with an additional distribution day, which will change the market status to a confirmed downtrend.
On a daily chart, the index is forming lower highs and lows, which are short-term negative. It closed below the monthly Volume Weighted Average Price (VWAP). The Nifty registered higher volumes after forming a lifetime high on July 20, the declined days. In the last 15 days, the index closed negatively for ten days. As many as nine days, volumes were recorded above average. This volume spike, along with the price decline, is a clear indication of a distribution.
The India VIX is rising after forming a low on July 27. It is up by 20 per cent from the low 9.88 to 11.52. Still, the volatility is at a historical low, which may affect the price. If the VIX moves above 12.21, expect the index to decline sharply. If it rises and still historically at the lower band, this leads to a violent move and profit booking. As discussed earlier, the declines are limited to 2-3 days since March lows. Interestingly, the current counter-trend is 15-day-old and the longest one. Three lower highs and lower closing closings on a weekly basis are an indication of weakness, and 19,992 points is an intermediate top. A close above the latest lower high of 19,645 points and the 20DMA of 19,656 points is positive and pauses the downward move. The Nifty may start the fresh week on a flat note; we have a truncated week.
For the last eight days, the RSU has been in the neutral zone. It closed at the prior low, and a decline below 47-45 means a strong bearish signal. The MACD line is declining, and the histogram shows an increased bearish momentum. The Elder’s impulse system has formed a bearish bar. For next week, the 19,240-300 zone is crucial. As the index has formed three consecutive bearish candles on a weekly chart, we may see some small bounce from the support zone. From a short-term perspective, the 19,300-656 zone is crucial. Either side breakout will result in decisive directional bias. The defensive sectors like Pharma, IT and PSUs are looking strong and displaying outperformance. A selective approach and low position size, and modest leveraged positions are advised.
(The author is Chief Mentor, Indus School of Technical Analysis, Financial Journalist, Technical Analyst, Trainer and Family Fund Manager)

