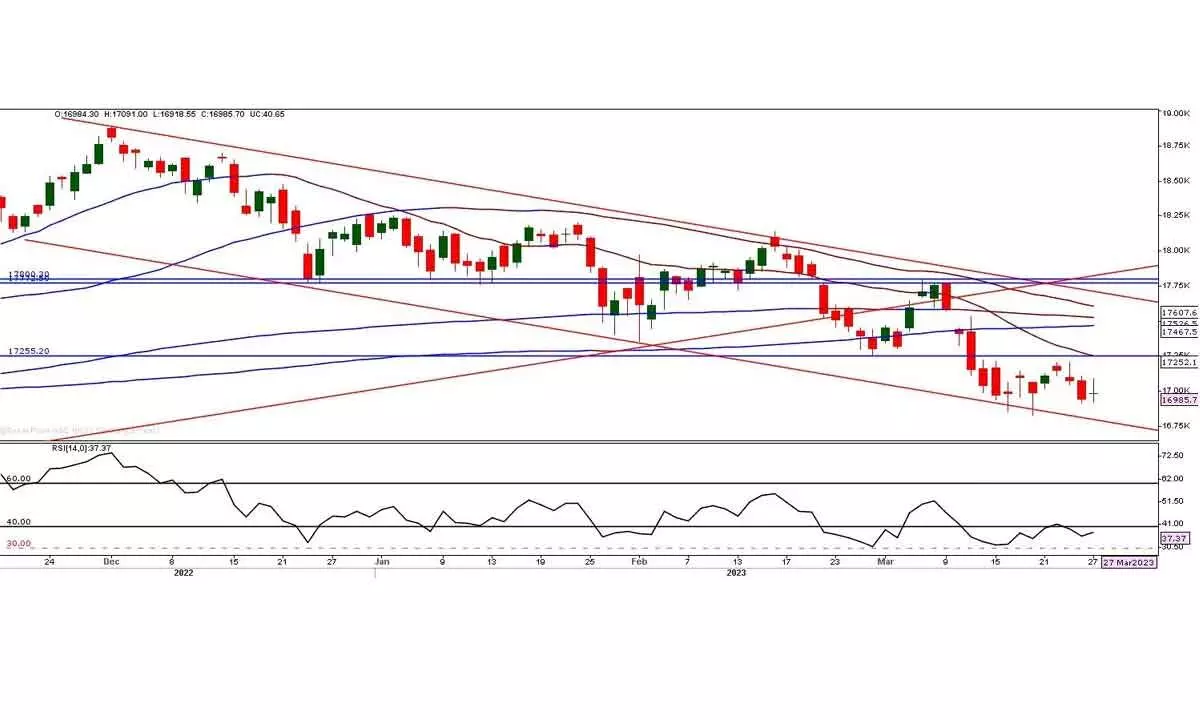
Nifty forms perfect Doji candle
The week opened on a positive note, and the market almost ignored the STT increase.
image for illustrative purpose

The week opened on a positive note, and the market almost ignored the STT increase. NSE Nifty gained by 40.65 points or 0.24 per cent and settled at 16,985.70 points. Nifty Pharma is the top gainer with 1.08 per cent. The Bank Nifty, FMCG, and IT indices closed with small gains of 0.05 per cent to 0.28 per cent. The Realty and Media indices are down by over a percentage point. All other sector indices are down by less than a percentage. The Market breadth is extremely negative as 1590 declines and just 390 stocks advance. Only some of the weight stocks protected the market today. About 412 stocks hit a new 52-week low, and 159 stocks traded in the lower circuit. HDFC Bank, Reliance, and ICICIBank were the top trading counters in terms of value.
NSE Nifty has formed a perfect Doji candle and an inside bar. With increased volatility, its up-and-down swings have not given any directional trade. On an hourly chart, it formed a long shadow candle, which indicates a fight between bulls and bears. The volumes were a little lower than the previous day. As the Index formed Doji and an inside bar, there is no trend change implications. The Nifty closed below the hourly moving average ribbon, and the MACD sustained below the zero line, which is bearish. On a much lower time frame (5 minutes), the Nifty has moved in three up swings and three down swings. The last 30-minute decline erased all the swing gains and closed exactly where it opened. The long hourly bars are the result of high volatility. The last hour bar shows the renewed selling pressure. As we mentioned earlier, the 16747-598 zone of support is very crucial for the market. The Index may bounce from near this zone. On the upside, a move above the prior day's high is crucial for a technical bounce. A close above the last week's high of 17207 will result in a double bottom breakout. The 20DMA is at 17252. A decisive move above 17207-252 will be a positive for the market, and it can test the 17428-467 zone. For now, be neutral and wait for the right time to enter a directional tradebe neutral and wait for the right time to enter a directional trade.
(The author is Chief Mentor, Indus School of Technical Analysis, Financial Journalist, Technical Analyst, Trainer and Family Fund Manager)

