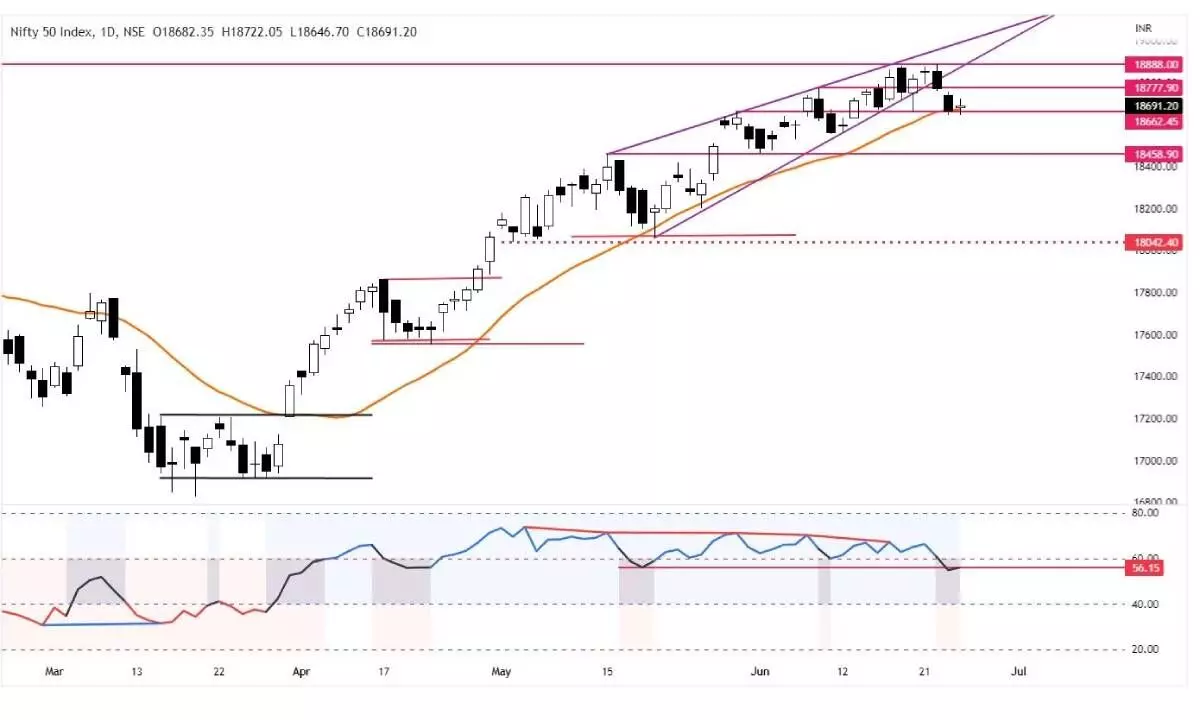
Nifty forms Doji on charts
Hourly MACD shows a decline in strong bearish momentum on an intraday basis; volumes declined further as traders not interested in building up fresh positions
image for illustrative purpose

The benchmark indices snapped a two-day decline. NSE Nifty is up by just 25.70 points or 0.14 per cent. The Pharma and IT sectoral indices were the top gainers with 1.53 and 1.15 per cent, respectively. The Energy, Infica, PSE and CPSE indices declined by 0.12 to 0.43 per cent. The other sectoral indices are up by 0.9 to 0.76 per cent. The market breadth was positive as the advance-decline ratio is at 1.31. About 63 stocks hit a new 52-week high, and 68 stocks traded in the upper circuit. Adani Enterprises, Reliance and HDFC Bank were the top trading counters on Monday in terms of value.
The Nifty is in a tight range after two days of sharp decline. It closed above the 20DMA and formed a Doji candle, though the index traded below this for most of the time. The volumes were further declined as traders were not shown interest in building up fresh positions. In fact, the index was traded in just 50 points range most of the time. It formed a lower low candle, but did not give any decisive trend change implications. The 18,660 level acted as strong support again.
The MACD histogram shows increased downside momentum. The RSI is below the 60 zone. On an hourly chart, the index is trading below the moving average ribbon. With the day-long sideways action, the hourly MACD shows a decline in strong bearish momentum on an intraday basis. As we entered into the expiry week, the rollovers were less than the average. The open interest of 15.88 per cent shows that the long positions were buildup. The PCR rose to 0.94, and the market is struggling to move higher. This week’s close is very important for the trend to protect from the downside and continue the rally from the key support. As mentioned earlier, a decisive decline below 18,660 levels will be a strong bearish sign. On the upside, the index must close above 18,757pts for an uptrend to continue. But if it declines below 18,660pts, the support is at 18,458 levels.
(The author is Chief Mentor, Indus School of Technical Analysis, Financial Journalist, Technical Analyst, Trainer and Family Fund Manager)

