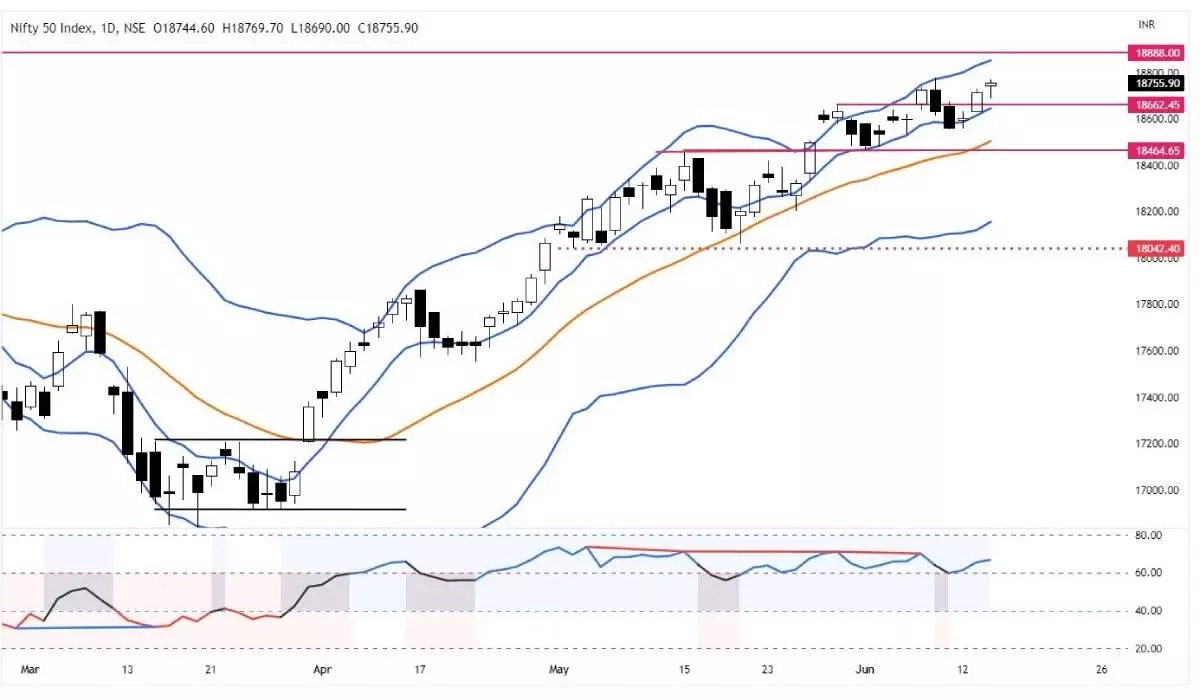
Nifty forms bearish Hanging Man candle
The support levels are rising on upside, unless support levels of 20DMA at 18,564pts and 8EMA at 18,645pts are breached with high volume selling pressure, it is unfavourable for short sellers
image for illustrative purpose

The Metal stocks and Reliance helped NSE Nifty scale high. NSE Nifty gained by 39.75 points or 0.21 per cent and closed at 18,755.90 points. The Nifty Metal index is the top gainer with 1.42 per cent, followed by the Energy index with 0.98 per cent. The PSE index hit a new lifetime high on Wednesday. The FMCG and Infra indices gained over 0.5 per cent. The Bank Nifty and FinNifty closed with a 0.25 per cent decline. The Advance-Decline ratio is at 1.19. About 150 stocks hit a new 52-week high, and 80 stocks traded in the upper circuit. HDFC Bank, Reliance, and ICICI Bank were the top trading counters on Wednesday in terms of value.
The frontline index, Nifty, continued to rise for the third straight day. It almost tested the last week’s high and formed a hanging man candle. It closed above the previous day’s high. The volume also continues to increase towards the average volume. As we discussed on Tuesday, there are no bearish signs available now, even though the Hanging Man candle is normally a bearish sign. All the moving averages are in an uptrend. The support levels are rising on the upside. The 20DMA is now at 18,564pts, and the 8EMA is at 18,645pts. Even on the hourly chart, the index has been trading above 8EMA for the last two days. Unless these supports are breached with high volume selling pressure, there is no favourable risk-reward ratio for the short sellers.
The index tests the patience of traders for a breakout, as it consuming more time in the current swing. The Average True Range (ATR) is shrinking along with the waning momentum. The RSI’s negative divergence is still intact. But, these weaker signs failed to influence the price action. Nifty has to close below the 18,645-504 support zone decisively for a bearish bias. Otherwise, continue with the trend as long as it trades above the previous day’s low. The all-time high is just 132 points away. On a breakout, it may form a new lifetime high. Stay positive and apply strict stop loss on a long trade.
(The author is Chief Mentor, Indus School of Technical Analysis, Financial Journalist, Technical Analyst, Trainer and Family Fund Manager)

