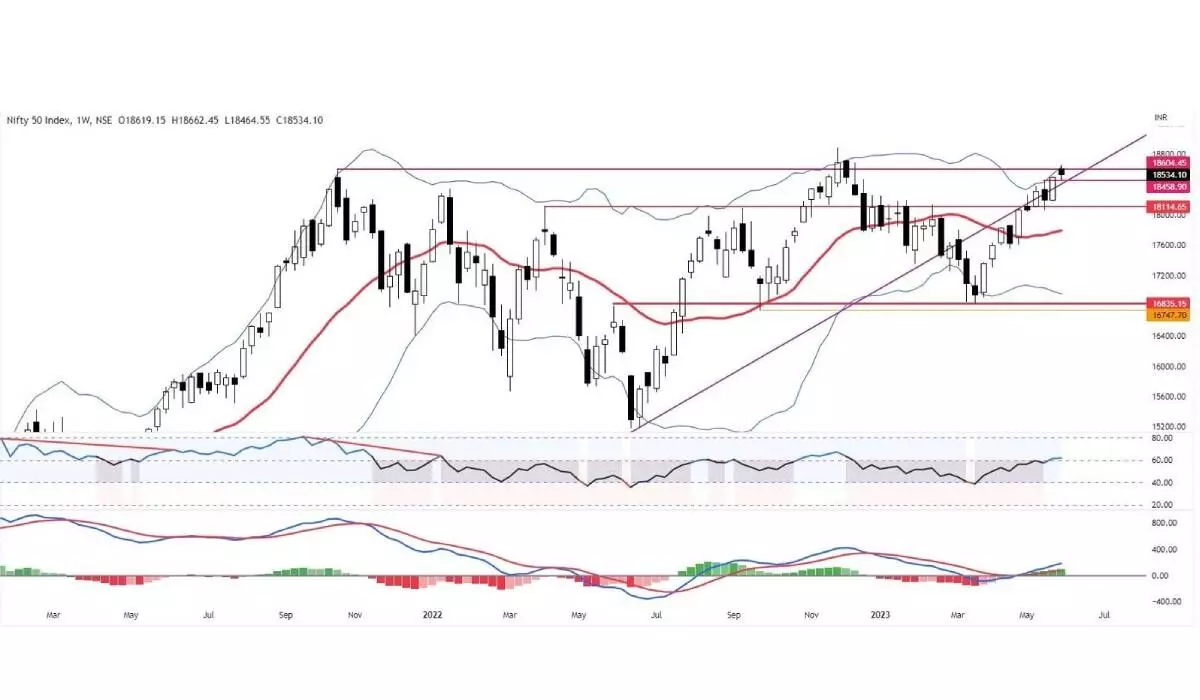
Nifty charts indicate fresh bullish signals
SGX indicates possibility of a huge gap-up opening on Monday; RSI remains in bullish zone with a negative divergence and 20-week average turned up after a contraction, which is a positive sign and shows more upside potential
image for illustrative purpose

NSE Nifty ended on a muted note after trading in 198 points range. Finally, it ended with just a 34.75 points gain. BSE Sensex also closed flat with a 0.07 per cent gain. Midcap-100 and Smallcap-100 indices outperformed by 1.62 per cent and 3.10 per cent. Nifty Realty and Media were the top gainers with 3.87 per cent and 3.15 per cent, respectively. On the flip side, Nifty Energy is down by 1.87 per cent, and Bank Nifty declined by 0.18 per cent. The Advance-Decline ratio was mostly positive last week. During the last month, FIIs bought Rs27,856.07 crore worth of equities, and the DIIs sold Rs3,306.35 crore. In the first two of June, FIIs sold Rs729.95 crore, and the DIIs bought Rs1,070.78 crore worth of equities.
The Nifty traded in the narrow range after opening with a gap-up opening. It failed to sustain the opening gains of the week and closed below the opening. It took support at 8EMA in the last two days and formed an inside bar on Friday. We can consider the last five days of price action as it is consolidation in nature. It neither broke the supports nor went below the previous week’s close. The Nifty rose for the second consecutive week after April's first week. The previous highest closing is 18,812.50pts, and the weekly highest closing is at 18,696.10pts. This zone is immediate resistance. If the Nifty breaks above this zone, the immediate target is at 19,455pts.
The buoyant global markets, after the agreement on the debt ceiling improve sentiments in the domestic markets. On contrary to the euphoric global market’s rally, the CBOE VIX declined to 14.60, which were down by 6.71 per cent on Friday. The DXY advanced towards 104.04. The India VIX is also at a lower level of 11.12. As these have inverse relationships with benchmark indices, we may see an interesting price action next week.
The Nifty closed at the upper Bollinger band, and the 20-week average turned up after a contraction, which is a positive sign and shows more upside potential. The daily MACD has given a fresh bullish signal. RSI is in the bullish zone with a negative divergence. But the SGX indicates the possibility of a huge gap-up opening on Monday. In any case, if the Nifty closes above 18,663pts, we can see a strong breakout. On the downside, it seems, the probabilities are becoming thin for now. Only a close below the prior week’s low is negative. On several occasions, the bearish patterns failed in the recent past. Until any bearish patterns get confirmation, wait patiently for an opportunity.
The Nifty Consumption, Auto, Midcap-100, Realty, Pharma, and Bank Nifty are inside the leading quadrant of the RRG charts. These stocks are likely to relatively outperform the broader Nifty-500 index. Focus on these sectors for trading opportunities. The Energy index is placed in the improving quadrant, but the momentum is waning.
Overall, the markets are at a crucial level. Any move above 18,696 will lead to a breakout, though there are concerns like low VIX, rising Dollar Index, and not an impressive market breadth. Continue with a positive bias with strict stop loss, and focus on protecting the profits. Stay vigilant and book profit at every higher level.
(The author is Chief Mentor, Indus School of Technical Analysis, Financial Journalist, Technical Analyst, Trainer and Family Fund Manager)

