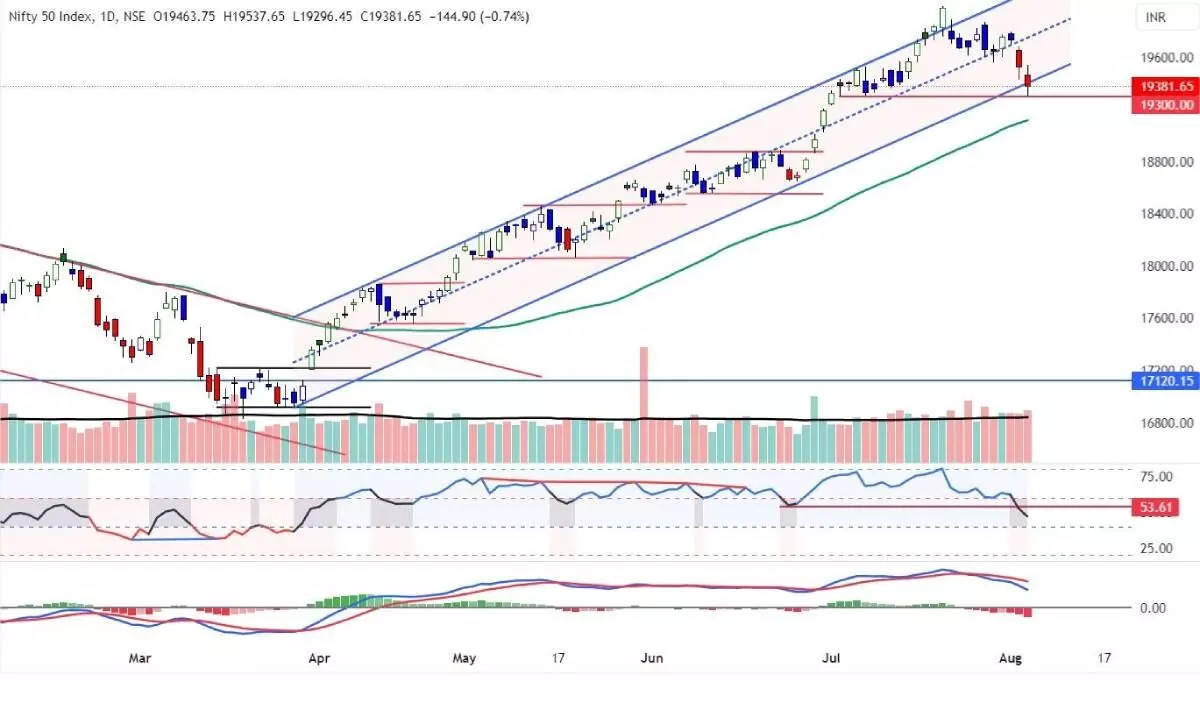
Nifty chart formations show a pause in trend
MACD histogram suggested an increase in bearish momentum, where other indicators like DMI and Elder impulse system gives bearish signal in current uptrend
image for illustrative purpose

The equity benchmark indices tumbled for the second day with continued selling pressure. NSE Nifty declined by 144.90 points or 0.74 per cent and settled at 19381.65 points. The Nifty Pharma and Media indices were the gainers with 1.04 per cent, and 0.91 per cent, respectively. The Mid-cap and Small-cap indices also gained by 0.25 per cent and 0.12 per cent. Nifty Realty is the top loser with 1.78 per cent. The FinNifty and Bank Nifty are down by 1.17 per cent and 1.07 per cent, respectively. All other indices were down over half a per cent. The Advance-Decline ratio is at 1.06. About 95 stocks hit a new 52-week high, and 71 stocks traded in the upper circuit. Vedanta, HDFC Bank, ICICI Bank, and IRFC were the top trading counters for Thursday in terms of value.
The Nifty broke down the rising channel with above-average volume. It also tested the 4th July low. As we expected, the index tested the lower Bollinger band and completed the mean reversion. Now, the index is 1.28 per cent below the 20DMA and just 1.32 per cent above the 50DMA (19,115 points), which is the nearest strong support. The index declined by 3.48 per cent from the all-time high of 19,992 points, which is the highest fall in the uptrend from the March low. As the index formed a major lower low, we can assume that the trend has paused for now. A retracement towards the 20DMA is possible, which is normal to form a lower high. Because of the expiry activity, the index bounced by 108 points in the last hour of trading.
The RSI declined below 47.02 after the March low. The MACD line sharply declined, and the histogram suggested an increase in the bearish momentum. Importantly, the -DMI crossed the +DMI, which is the first bearish signal. At the same time, the Elder impulse system has formed a second consecutive bearish bar in the current uptrend. With higher volume in the last five days and above average, the Nifty added another distribution day. Currently, it holds three distribution days. An increase in the distribution day count to five, and a decline below 50DMA (19,116 points) will change the market status to a downtrend. As stated earlier, the volume has increased since the 12th of July in the topping formation, indicating a strong distribution. Currently, any bounce can be considered an exit route. The index formed a long-legged, small-body candle at the end of the day, which may lead to an inside bar. In any case, if the index decline below 19,300 points or Thursday’s low, it will continue the downward move and test 19,116 points. On the upside, only a move above Thursday’s high of 19,538 points is positive and can test the 20 DMA. Stay away from long positions for now. The weekly close is crucial for the trend change.
(The author is Chief Mentor, Indus School of Technical Analysis, Financial Journalist, Technical Analyst, Trainer and Family Fund Manager)

