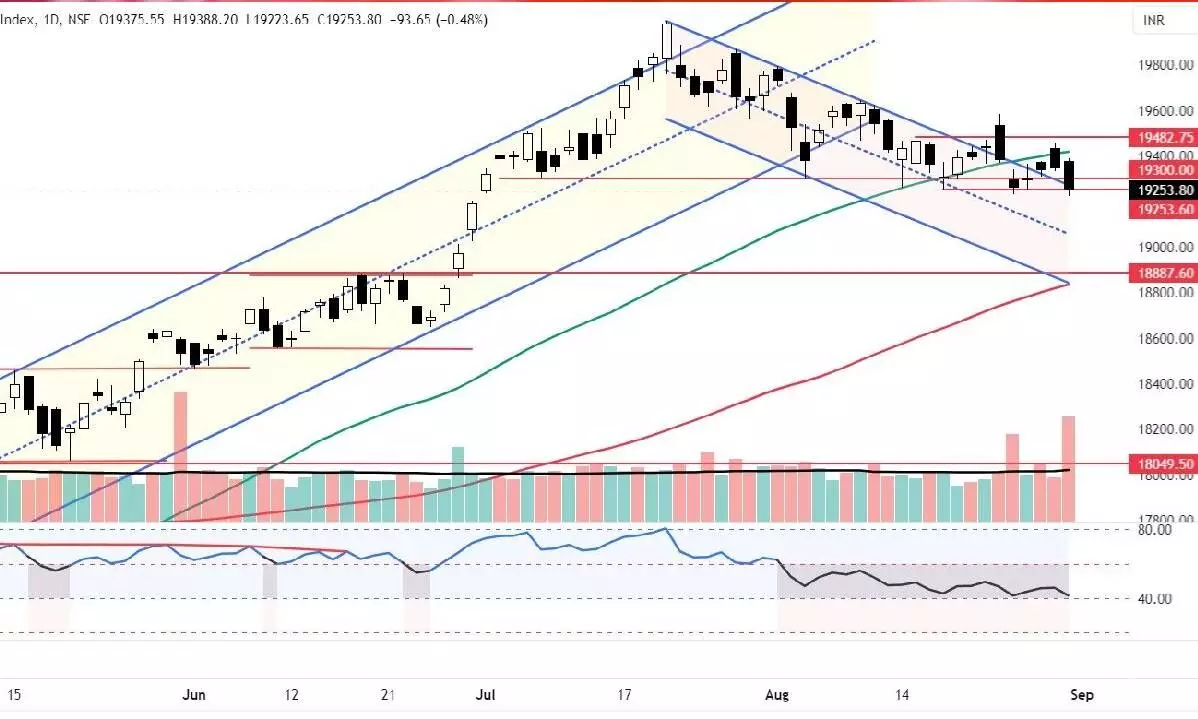
Nifty back into sloping channel
Benchmark index formed Shooting Star candle; Bollinger bands are in a downtrend and the expansion of the bands indicates further selling pressure
image for illustrative purpose

The equity benchmark indices tumbled on a monthly expiry day. With the intensified selling pressure, NSE Nifty declined by 93.65 points or 0.48 per cent. Nifty IT and Realty indices are up by 0.20 per cent and 0.65 per cent, respectively. The Nifty Midcap and Smallcap indices also outperformed the benchmarks today with 0.11 per cent and 0.81 per cent gains. All other indices were declined. The Energy and FMCG index was down by 0.91 per cent and 0.82 per cent, respectively. All other indices are down by 0.2 per cent to 0.90 per cent. The market breadth is negative. The India VIX is up by 2.22 per cent to 12.06. About 153 stocks hit a new 52-week high, and 68 stocks traded in the upper circuit.
On a monthly expiry day, the Nifty continued to decline and closed almost below the previous week’s low. It registered another distribution day, with a higher volume than the previous three days. Volumes were much higher than the 24th of August. The Nifty opened with a positive note and failed to move above the first hour’s high. It formed lower-high candles. Like yesterday, the last fall was very sharp. By declining 155 points from the day high, the Nifty has formed the most bearish candle after August 24.
The index formed another Shooting Star candle on the weekly chart and an inside bar as of today. In any case, if it closes below 19,223 points, further selling pressure will emerge. The short-covering in the last 15 minutes, the Nifty has recovered almost 60 points from the low. The RSI is back in the 42 zone and lost its momentum. The MACD histogram shows a strong bearish momentum. The index closed below the last two day’s low. The Elder impulse system has formed a strong bearish bar. The 20 DMA is almost cross under the 50DMA is short-term negative.
In fact, the index is back into the sloping channel. The Bollinger bands are in a downtrend, and the expansion of the bands indicates further selling pressure. For now, the price structure is not positive. As the is declining for the fifth straight session, the index may witness a small pullback next week. Only IT, mid- and small-caps have outperformed the benchmark today. For a positive move, the index must close above the 19350-410 zone. But a close below 19,229 points is negative, and it can test the prior breakout level of 18,887 points. The market structure is now clearly bearish with more distribution days. It is advised to stay away from the long positions.
(The author is Chief Mentor, Indus School of Technical Analysis, Financial Journalist, Technical Analyst, Trainer and Family Fund Manager)

