Merchandise exports rise 45% to $33.17 bn during August
80 products account for half of exports value in Q1
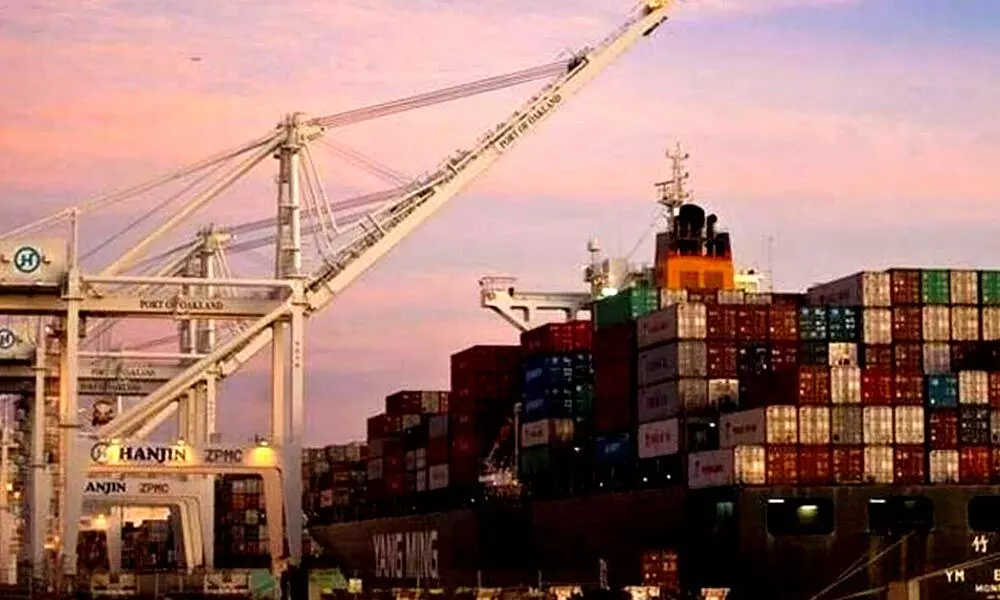
image for illustrative purpose

The contribution of exports has shown volatility with weighted contribution turning negative in years of global slowdown. With global recovery on tenuous grounds, India needs to be cautious about its export's growth-- Soumya Kanti Ghosh, SBI group's chief economic advisor
Mumbai: India's merchandise exports in August were $33.14 billion, an increase of 45.17 per cent over $22.83 billion in August 2020 and an increase of 27.5 per cent over $25.99 billion in August 2019. In April-August, the exports were $163.67 billion, an increase of 66.92 per cent over $ 98.05 billion in April-August 2020 and anincrease of 22.93 per cent over $ 133.14 billion in April-August 2019. India has set a target of $400 billion in merchandise exports for thecurrent fiscal year ending in March 2022, compared to $291.2 billion in the previous fiscal year. Thus, till August, 41 per cent of thetarget has been achieved, says a report by SBI economists.
A deep dive into the 8-digit HS (Harmonized System) level exports shows that 80 products accounted for half of the exports value in Q1 FY21-22. Individually, Diamond exports have the largest share at 6 per cent followed bydiesel fuel at 5 per cent, it added.
If we sort these 80 items into broad categories, they belong to Petroleum and Energy, Gems and Jewellery, Agri, Fishery, Meat and Allied, Chemicals and Pharma, Metal products and Transport equipment including Auto, Ships, Rail and Airplanes. At 2-digit HS category these products span across 32 2-digit classifications. The classifications undergo revision and an accurate comparison at 8-digit level is not possible. However, if we go back to Q1 FY12-13, and aggregate the number of products with 50 per cent share there are only20 HS-2 categories.
Thus, diversification has taken place over the years. Chemicals and pharma, metal products, textiles, machinery, plastics and rubber and their articles, and furniture are grabbing more share in the exports. However, this is only a quarterly comparison and the yearly figures will show the complete picture. If we look at the yearly compositional shift, then over the last 25 years, the top 20 HS-2 categories have accounted for around 74 per cent-80 per cent of the total exports.
Certain agri-based products like residues and wastes from food industries, animal fodder, coffee, tea, mate and spices and labour-intensive products like carpets and footwear have exited the top commodity export list. Meanwhile, certain components like Aluminumand articles thereof and Ships, Boats and floating structures exports have grown rapidly and are now part of the top exports. There are certain other products which started with a very low base, but have shown rapid growth like furniture, parts of aircraft and space craftand zinc and at 8-digit level are now part of the top 50 per cent exports.
But the core exports base has remained static with Gems and Jewellery, and petroleum products being the most prominent components. Both have an inherent volatility, and this subjects country's overall exports to overall volatility. By increasing the share of machinery among the Engineering Products, Electronics, Drugs and Pharmaceuticals, India can offset this volatility to an extent. However, it has to be kept in mind that the primary engine of growth for India remains consumption and unless that improves it is difficult for India to achieve higher growth on a sustained basis. For Q1FY22, in the overall GDP growth, the percentage share of the weighted contribution of exports was 40 per cent, while that of final consumption expenditure was 49 per cent. However,the share of net exports was at a negative 18 per cent, as imports had also jumped in Q1FY22."The contribution of exports has shown volatility with weighted contribution turning negative in years of global slowdown. With global recovery on tenuous grounds, India needs to be cautious about its export's growth," SBI group's chief economic advisor Soumya Kanti Ghoshsays.
Meanwhile, it can focus on building the capacity in local manufacturing. Centre has recently notified RoDTEP Scheme Guidelinesand Rates (Remission of Duties and Taxes on Exported Products). Under the scheme various Central and State duties, taxes, and levies imposed on input products such as duty on power charges, VAT on fuel in transportation, farm sector, captive power generation,mandi tax, stamp duty and central excise duty on fuel used intransportation, among others, would be refunded to exporters, as a percentage of FOB value of exports, he said. The tax refund rates range from 0.5 per cent to 4.3 per cent forvarious sectors. The scheme excludes certain sectors like iron and steel, articles of Iron and Steel, Chemicals and Pharmaceuticals. There is provision for reviewing the RoDTEP rates on an annual basis whichwill be notified well in advance before the beginning of a financial year. The scheme is in nascent ages and is expected to incorporate the changes that are being suggested by industry bodies. This inconjunction with the PLI scheme can create a strong base for manufacturing led exports by India.

