Flat trading for Nifty more likely
A decisive breakout or breakdown will ensure good directional trading opportunities
image for illustrative purpose

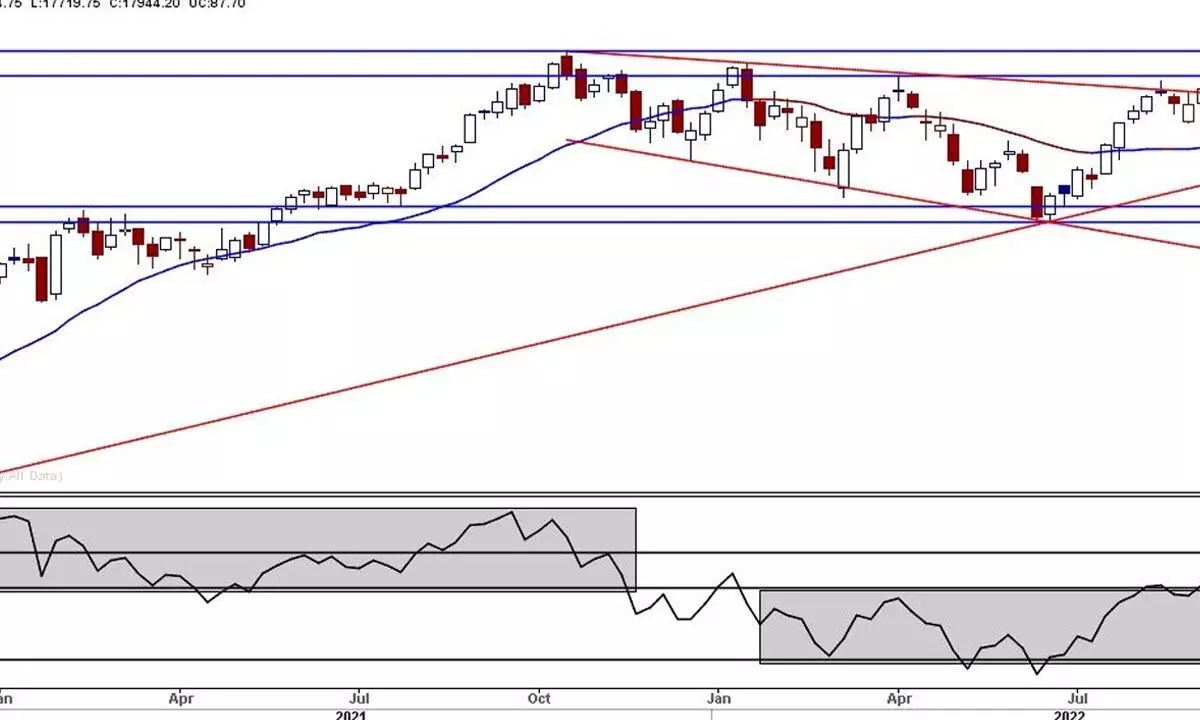
The Indian stock market is still directionless, though it made a futile effort to break the budget day range. NSE Nifty hardly gained 87.70 points or 0.49 per cent after volatility of 415 points. The BSE Sensex gained by 0.53 per cent. The broader market indices were unable to perform like benchmark indices. The Nifty Midcap-100 and Smallcap-100 indices are down by 1.25 per cent and 1.14 per cent, respectively. The gaining sector indices, The Nifty IT and Metal, were positive by just a little over half a per cent. Nifty PSU Bank, Realty down by over 2.5 per cent. The market breadth is negative. The India VIX is still at the lowest level at 13.09. FIIs turned positive during the week, as they bought for the longest streak in recent times.
The benchmark index has been directionless for the last two months as it is trading in a broader range. After an unsuccessful effort last week, it failed to close above the 20-week average. The Nifty formed a long-legged small body candle on a weekly chart. Even though the index has formed a higher low and higher high candle, the bullish strength has not emerged. After forming two successive bull candles, the Nifty failed to continue the momentum. On Thursday, it was unsuccessful in holding the opening gains and formed a bear candle. As we discussed earlier, the 18100-265 zone acted as strong resistance last week. The efforts of crossing 50DMA also failed on Thursday and formed an Evening Star candle, which got the confirmation for its bearish implications, closing below the previous day's low. It also formed a long-legged Doji candle. On a daily chart, the index has formed a rising wedge kind of pattern and closed on the crucial support. Any move below Friday's low (17884) and 20DMA (17847) will resume the downside move in an impulsive way. As long as it trades below the 18100-265 zone of resistance, the upside potential is limited. The 20-period double exponential average is at 17847, which may act as immediate support.
The volatility index, India VIX, remains near a historically lower level. This is the cause of concern for now, as it has an inverse relationship with the benchmark indices. Generally, the low VIX will cause a decline in the market, and the indices will form swing highs. The continuation of VIX indicates the complacency of traders. Longer the complacency higher the probability of an impulsive move. A reasonable spike in VIX will cause the market will decline. Last Thursday, the Nifty faced resistance at a 50 per cent retracement level of the 1st December 2022 to 1st February decline. The counter-trend rallies normally end at the 50-62 per cent retracement level. That's the reason Thursday's high is crucial for the bulls. Any further up move will be possible only if the Nifty closes above 18134 convincingly.
The weekly and daily RSI is just above 50 and in a neutral zone. There is no divergence visible now. The weekly and daily MACD is also still below the zero line. Though the daily MACD line is near the zero line, the momentum is not convincingly bullish. Incidentally, the weekly and daily ADX, which is the trend strength indicator, is declining. The JDK-RS-Momentum line is also declining and on the 100 line, which shows a lack of momentum. The Elder impulse system has formed a neutral bar.
The Nifty may trade on a flat note next week too. We may only be able to get good directional trading opportunities if there is a decisive breakout or breakdown. The Nifty IT, Pharma, and Auto sectors may outperform and trade selectively in these sector stocks.
(The author is Chief Mentor, Indus School of Technical Analysis, Financial Journalist, Technical Analyst, Trainer and Family Fund Manager)

