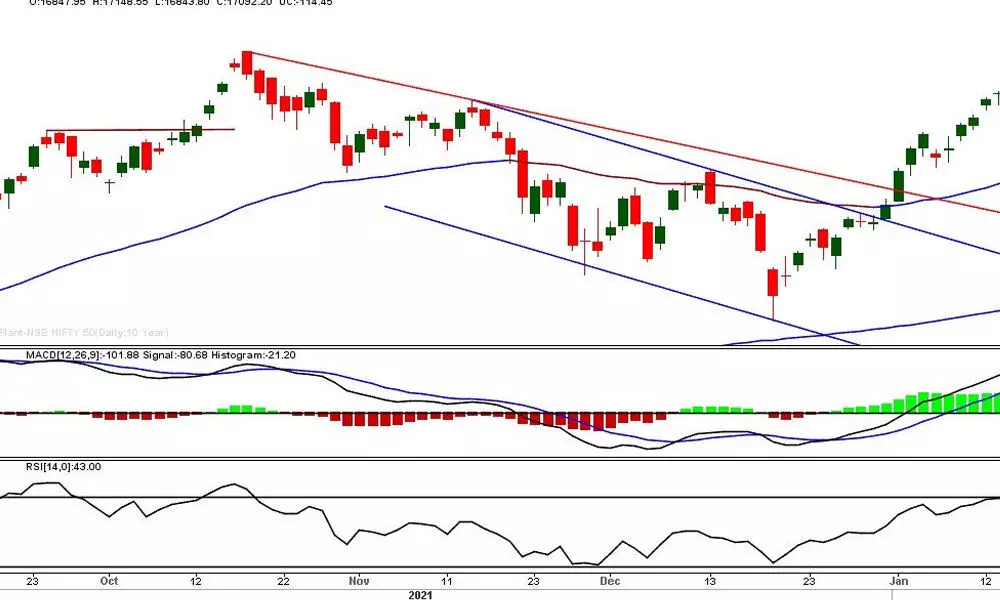
Except 200DMA, Nifty trading below all moving averages
The fundamentals of the markets are changing rapidly
image for illustrative purpose

The fundamentals of the markets are changing rapidly. Crude oil prices hit a seven-year high. The rupee depreciated 31 paise against the dollar. The global markets are deep in the red. The domestic equity markets opened sharply lower and bounced from a critical support area. The Nifty ended at 17092.2 with 114.95 points or 0.67 per cent lower. The Media and the Realty indices are the worst hit with 3.3 per cent and 2.91 per cent. All the sector indices closed negatively. The PSU Bank, Metal, Midcap indices closed one per cent lower. Smallcaps-index declined by 2.05 per cent. The market breadth is extremely lower for the second successive day as 1687 declines and 411 advances. About 196 stocks hit a new 52 week low, and 318 stocks traded in the lower circuit. TCS is the top trading counter declined by 3.48 per cent.
The market opened with a 359 points gap down and, at the end of the day, filled the gap and closed near to the high. It recovered almost 300 points from the day's high. It almost tested the support zone of 16800 and bounced sharply in the afternoon session. Even though it recovered 300 points from the low, none of the sectors failed to close in the green. As the Volatility ruled the market, the India VIX jumped sharply to 27.81. With this Implied Volatility of the options also jumped sharply. The option premiums witnessed unimaginable volatility as the monthly series expires on Thursday.
Interestingly, the Nifty opened below the 200DMA. This is the second time in the last seven sessions. The index is trading below all moving averages, except 200DMA, currently placed at 16876. In any case, the Nifty closes below this long-term trend indicator, and the topping formation will get the confirmation for its bearish implications. The neckline of the Head And Shoulders pattern is placed in the 16800 zone. The pattern analysis shows the market structure is turning very cautious. The MACD histogram has increased to four days high. And the RSI declined to 43 zone. Historically, the Nifty took support at 35-40 several times.
(The author is Chief Mentor, Indus School of Technical Analysis, Financial Journalist, Technical Analyst, Trainer and Family Fund Manager)

