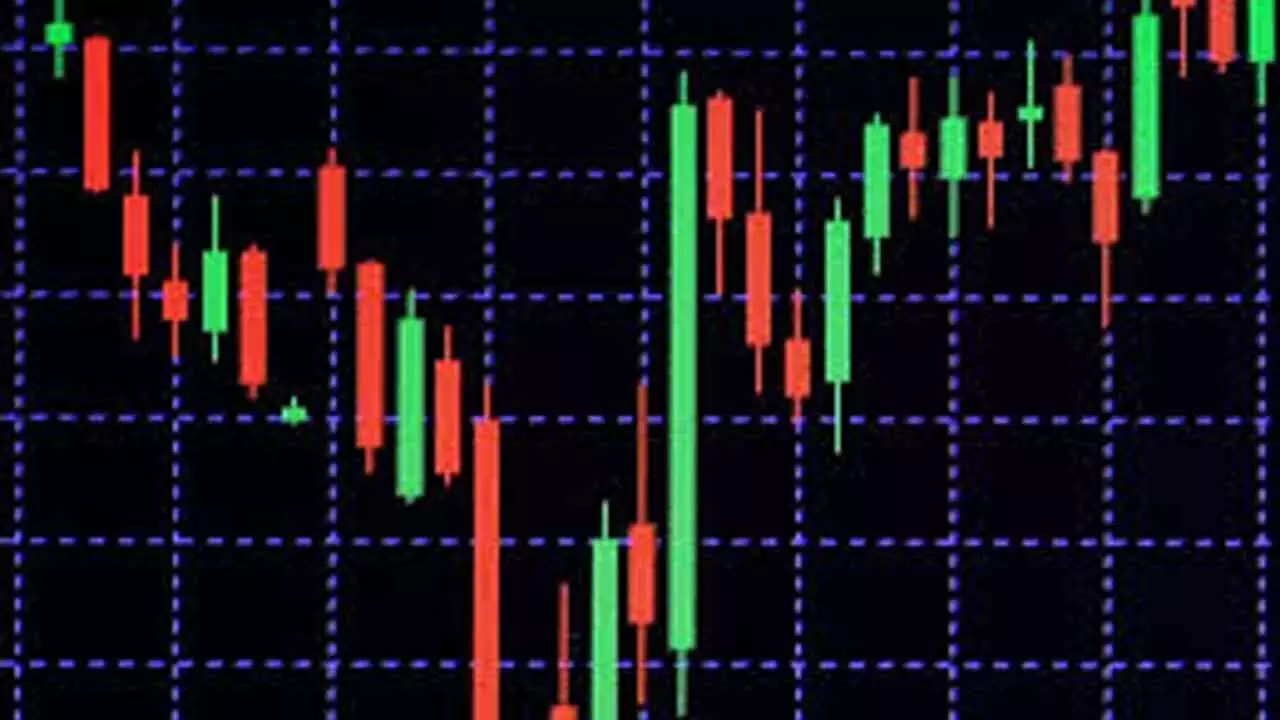
Daily Charts Signal Bearish Candle
Market may further weaken from current levels; Sensex could retest level of 80,300, it can further downside to 80,000; On the other side, a dismissal of 81,000 could push the market up to 81,300-81,400
Daily Charts Signal Bearish Candle

Mumbai: On Tuesday, the benchmark indices witnessed selling pressure at higher levels. BSE Sensex was down by 156 points. Among sectors, most of the leading sectoral indices registered intraday profit booking, but the PSU Banks index lost the most, shedding five per cent. Technically, after a muted open, the market consistently faced selling pressure at higher levels. A bearish candle on daily charts and a lower top formation on intraday charts indicate further weakness from the current levels. Shrikant Chouhan, Head-Equity Research, Kotak Securities, said:“We are of the view that as long as the market is trading below 81,000, the weak sentiment is likely to continue.”On the lower side, the market could retest the level of 80,300. Further downside may also continue, which could drag the index down to 80,000. On the other side, a dismissal of 81,000 could push the market up to 81,300-81,400.
The current market texture is non-directional; hence, levels-based trading would be the ideal strategy for day traders.
Prashanth Tapse, sr V-P (research), Mehta Equities, said: “Weak global market cues weighed on sentiment and pushed local indices in deep red towards the close, but ended off lows amid profit taking in banking, realty and oil & gas shares.”
Investors continue to maintain caution amid worries over the skirmishes on the Indo-Pak border, while falling crude oil prices indicate that a slowing global economy going ahead will hit demand.
STOCK PICKS
Hindustan Copper | TRADE-SHORT SELL | CMP: Rs207 | SL: Rs214 | TARGETs: Rs198–Rs192
Hindustan Copper has faced resistance near Rs214 and is now showing signs of weakness. After a brief rally, the stock has started to lose momentum and is forming a lower high on the chart. If it slips below Rs205, it could trigger further downside toward Rs198 and even Rs192. The broader structure looks cautious, and traders can consider short-selling near current levels with a stop loss at Rs214 to protect against any upside move.
CL Products | TRADE-BUY | CMP: Rs694 | SL: Rs670 | TARGETs: Rs730–Rs750
CCL Products has shown a strong breakout with a 17% jump today, backed by high volumes and strong buying interest. The stock has crossed key resistance levels and is now in a strong upward trend. This kind of breakout often leads to follow-through momentum in the short term. If the stock holds above Rs690, it can move toward Rs730 and Rs750. Traders can consider buying now or on minor dips, keeping a stop loss at Rs670 to manage risk.
(Source: Riyank Arora, technical analyst at Mehta Equities)

