Charts signal volatile trading ahead of Feb F&O expiry
Possible upward move as long as supports are protected; Profit booking likely at higher levels
image for illustrative purpose

The benchmark indices scale new highs. Before closing at a new high, NSE Nifty traded in a 422-point range and witnessed highly volatile sessions. Finally, it gained 172 points or 0.78 per cent last week. BSE Sensex is up by 0.96 per cent. The Small-cap index continued to underperform and was lost by 0.12 per cent. The Mid-cap index is up by 0.30 per cent. Nifty Realty is the top gainer with 4.08 per cent, and FMCG is up by 1.53 per cent. On the flipside, the Nifty IT index is down by 1.12 per cent, and the PSU Bank index declined by 1.12 per cent. The India VIX is down by 1.64 per cent to 14.97. The market breadth is mostly positive. The FIIs sold Rs15,857.29 crore, and the DIIs bought Rs20,925.83 crore worth of equities.
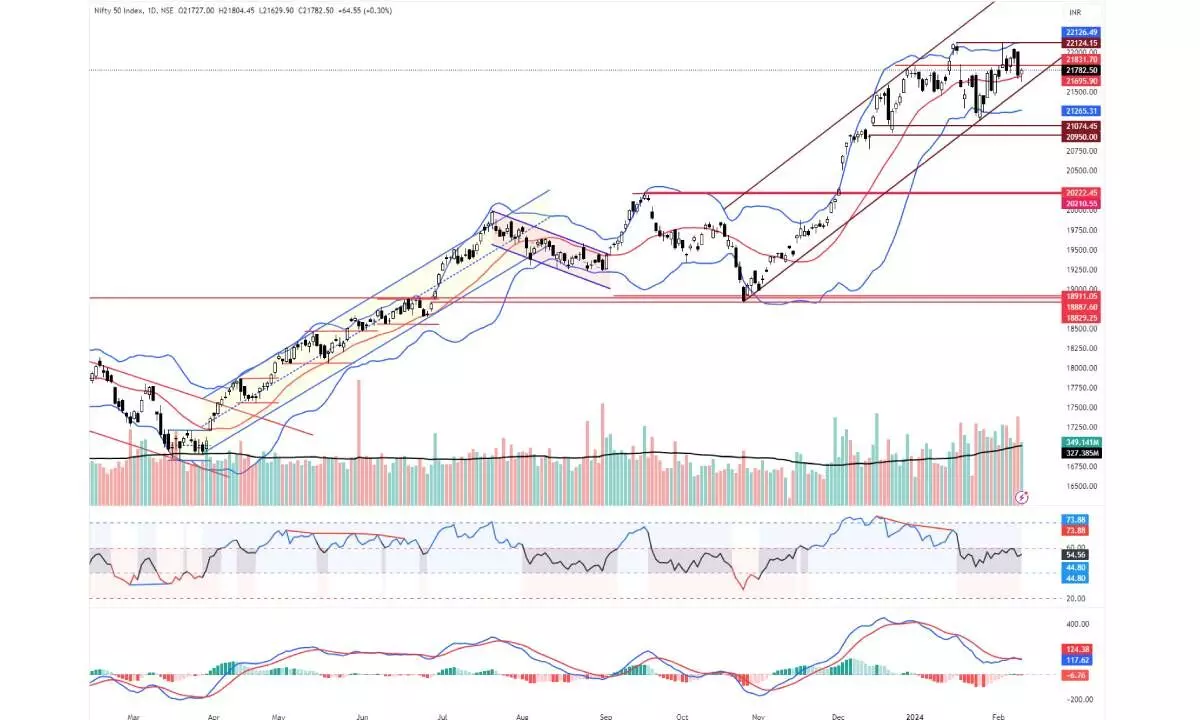
As we mentioned in the previous column, the Nifty has registered a range breakout. It decisively closed above the 22,127 points. On the face of it, the chart does not show any weakness. However, there are concerns, and some weird facts are worry factors. The first one is volume. The volumes were lower on breakout and on advancing days. Meanwhile, the declining days are attracting more volume. Currently, the Nifty is holding four distribution days. In a confirmed uptrend and bullish pattern breakout, these are weird things. Any pattern formation happens with declining volume, and on a breakout, it witnesses a volume spurt. At the same time, in a confirmed uptrend, the distribution day count will be normally limited 2-3, but this time it is four.
In an uptrend, the swings are clear and lengthy. Currently, the upswing or downswing does not exceed 2-3 days. In a minor trend, the swings normally last 5-8 days, and all the contractions will be lower than price expansions. The erratic moves create confusion in the current uptrend. Many of the Nifty-50 large-cap stocks are still underperforming, including heavy-weight stocks like Bajaj Twins, HDFC Bank, Kotak Bank, HUL, etc. On the sectoral front, there is a clear divide. They are either in the leading quadrant or in the lagging quadrant. This distinct division gives us an idea of sector rotation. Interestingly, many of the sectoral indices developed a negative divergence, including PSU bank, PSE, and CPSE indices, which have been outperforming for the past few months.
The 10-week moving average is acting as a strong support during the recent ascending base. This critical support rose to 21,750, and the 50DMA is at 21,688 points. Only a decisive close below this support zone added distribution days. The Bollinger bands are now in an uptrend after a flatness during the ascending triangle formation. The RSI has developed negative divergences in all time frames.
In these conditions, as long as supports are protected, be with the trend. There is a possibility of continuing the upward move. At the higher levels, profit bookings result in unexpected sharp downside moves. As the monthly derivatives expiry increases, volatility will increase. Intraday ranges will increase, and the stock-specific activity will continue. Fresh buying must be on light position size, and booking partial profits must be kept at higher levels.

