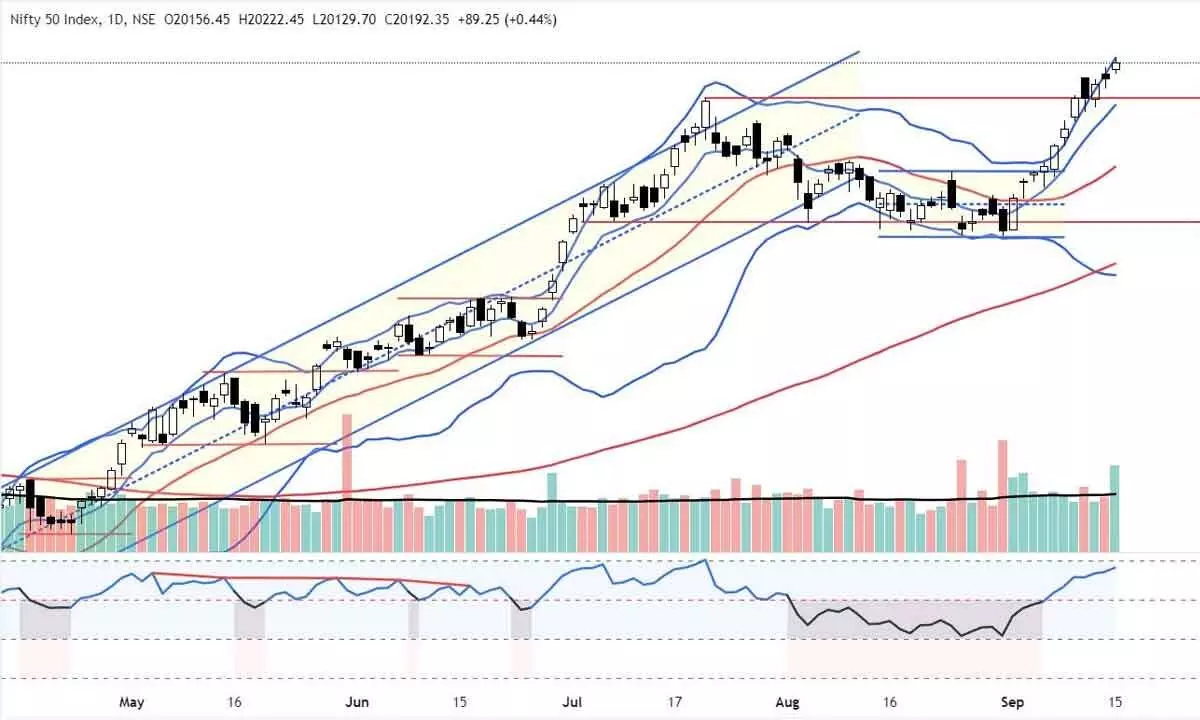
Charts indicating over-extended rally
NSE’s benchmark index formed a small body candle for 2nd session and price pattern looks like a spinning top or Evening Star; The volume was highest in this 11-day rally
image for illustrative purpose

The positive bias continued above 20,000 level as NSE Nifty gained by 89.25 points or 0.44 per cent, closing at 20,192.35 points. Nifty Auto is the top gainer with 1.58 per cent. The IT and Pharma indices were gained by 0.94 per cent and 0.61 per cent. The Metal, FMCG, Energy, and Realty indices declined by less than half a per cent. The Mid-cap and Small-cap indices are up by 0.28 per cent and 0.41 per cent,respectively.
The broader market breadth is positive as advances are more than declines. About 125 stocks hit a new 52-week high, and 87 stocks traded in the upper circuit. HDFC Bank, Reliance, and Mazdock were the top trading counters today in terms of value.
The Nifty closed positively for the third successive week. It gained 350.65 points or 1.77 per cent last week. The Nifty closed above the psychological level of 20,000 for three consecutive days and registered an all-time high. The 999-point rally in the last 11 days is an impulsive one. This over-80-degree rally may enter into a counter-consolidation. The Bollinger band expanded to the maximum. The index moved too far away from the 20DMA. The index has formed a small body candle for the second, and the price pattern looks like a spinning top or an Evening Star. The volume was highest in this 11-day rally.
The RSI (76.48) has reached to the near extreme levels. The MACD histogram has flattened. None of the indicators show any negative bias. But the price looks tired and over-extended. It is better to stay with more caution. Today, mostly traded in the tight range with increased volatility.
Buying and selling bouts were seen today. Before continuing the rally, it may retrace towards the 23.6 per cent retracement level of 19,986 points, which is almost the previous high. The 8EMA support is at 19,953 points. This zone of support is key for the ongoing bullish trend.
(The author is Chief Mentor, Indus School of Technical Analysis, Financial Journalist, Technical Analyst, Trainer and Family Fund Manager)

