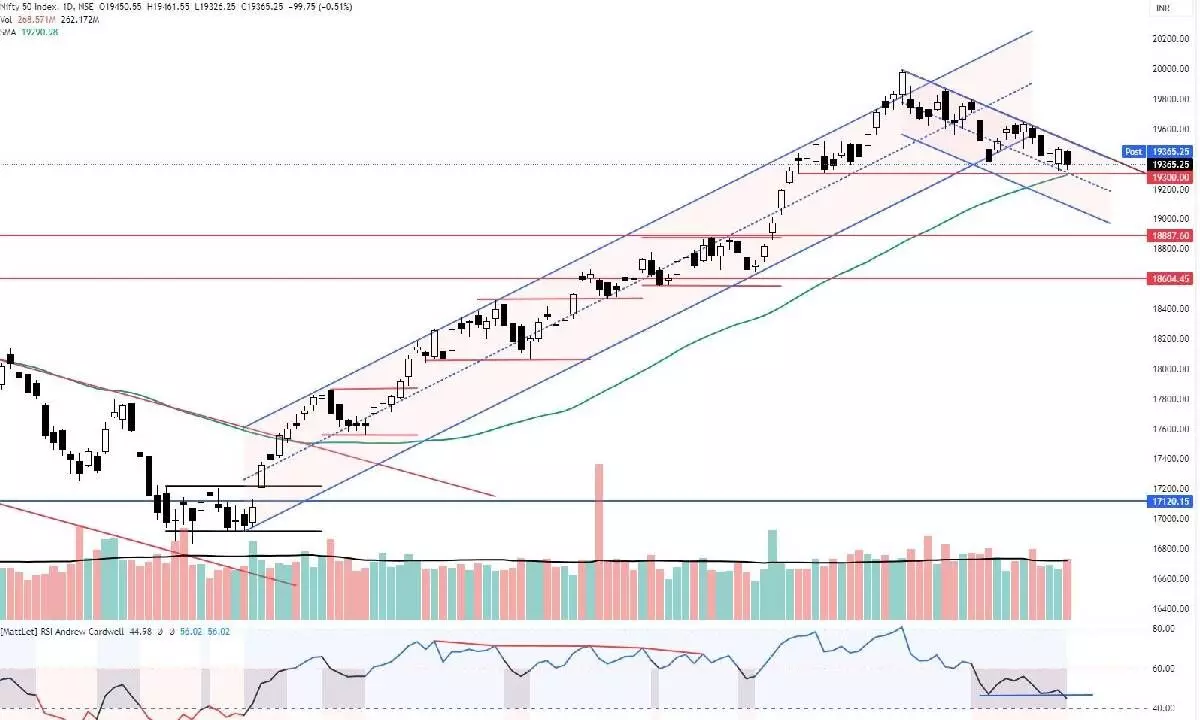
Charts indicate rising bearish bias
The index erased the previous day’s gains and formed an inside bar; It came close to 19,300 support level on expiry day; The volumes were higher than last four days
image for illustrative purpose

The NSE Nifty closed on a negative note after two days of positive closings. It closed at 19365.25 points, with a decline of 99.75 points or 0.51 per cent. The broader market indices, Midcap-100 and Smallcap-100, outperformed by 0.25 per cent and 0.14 per cent, respectively. Only the PSU Bank index gained by 1.43 per cent. All the sectoral indices were down. The Energy index is the top loser with 104 per cent, followed by the CPSE index with 0.92 per cent. The FMCG and Infra indices are down by 0.89 per cent, and 0.92 per cent, respectively. The market breadth is negative as the advance-decline ratio is at 0.91. About 128 stocks hit a new 52-week high, and 92 stocks traded in the upper circuit. HDFC Bank, ICICI Bank, and Cochin Shipyard were the top trading counters on Thursday in terms of value.
The Nifty erased the previous day’s gains and formed an inside bar. The broader market outperformed compared to the benchmark index. Except for the PSU bank index, all the sector indices closed with losses. Soon after opening, the Nifty dropped sharply till the late afternoon. The index came close to the 19,300 support, but as the expiry trades were on, the index recovered about 60 points in the last hour of trading, which attracted fresh selling pressure. The volumes were higher than the last four days. With a 0.51 per cent decline and higher volume than previous days, the Nifty registered another distribution day. Now the total distribution day count is at 6, which is bearish. The index typically behaves like declining for two days and two days advancing. As stated earlier, the index is not closing negatively for more than three days.
The RSI (45.51) closed below the prior lows and got confirmation of hidden divergence implications. In any case, if it declines below 40, it will be negative for the market. The Nifty remained in the range for the last three days, but the RSI has formed a new low. Now the 50DMA support is at 19,291 points. Now, the 19291-300 zone will be very crucial for the Nifty to be resilient to a bearish trend. The MACD line further declined to near the zero line. Histogram shows a fresh increase in bearish momentum. The ADX (26.96) declined to a mean level, and the positive directional indicator +DMI is further down, which is an indication of a weakening trend. The Elder’s impulse system has formed another bearish bar. Currently, the index is 1.23 per cent below the 20DMA. Bollinger bands are also in the downtrend. For the last three days, the Nifty has been taking support at the lower band. The Nifty may witness some minor pullbacks, but the price structure is negative. Only a close above the prior bar high, or 8EMA of 19,475 points, will be short-term positive. Stay cautiously negative; a move below 19,300-290 levels may lead to a violent profit booking or a sell-off.
(The author is Chief Mentor, Indus School of Technical Analysis, Financial Journalist, Technical Analyst, Trainer and Family Fund Manager)

