Charts indicate limited upside move
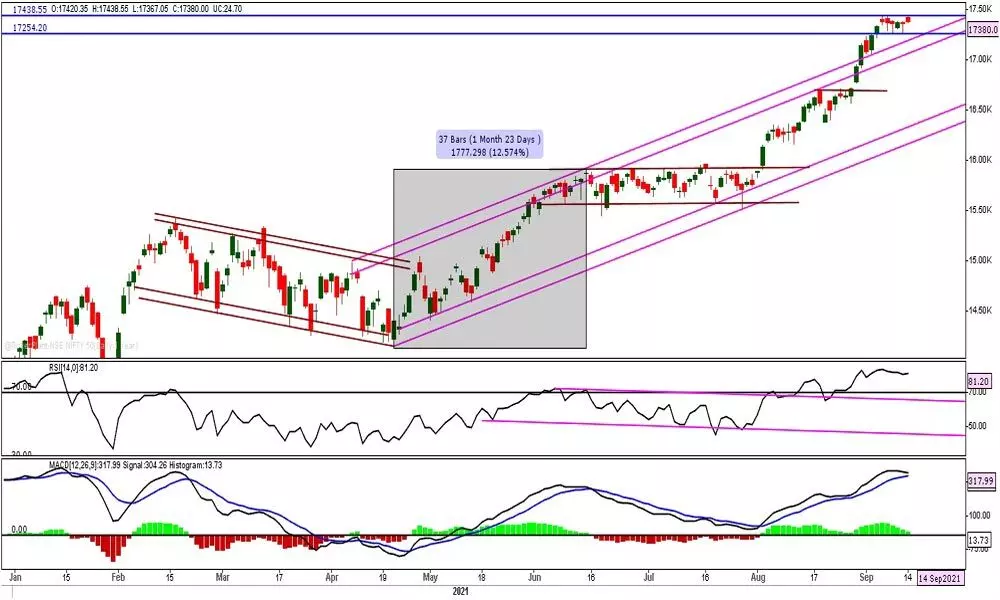
Time to wait and watch the consolidation period; The NSE Nifty exactly reacted from the previous top. It has made three tops at 17,429.55/ 17,436.50 & 17,438.55 levels
image for illustrative purpose

The equity market closed in positive territory, but did not sustain at the higher levels. The NSE Nifty gained by 24.70 points and ended at 17,380 points. The Nifty FMCG and Metal indices closed with minor losses. All the other sectoral indices closed in green. With a 40 per cent rise in ZEEL, the Media index up by 14.40 per cent is the top gainer. Midcap index outperformed the benchmark with a 1.35 per cent gain. All other sector indices up to an average of half a per cent. The VIX is down by 3.21 per cent. The overall market breadth is positive as 1,181 advances and 765 declines. About 129 stocks hit a fresh 52-week high, and 162 stocks traded in the upper circuit.
The NSE Nifty exactly reacted from the previous top. It has made three tops at 17,429.55, 17436.50 and 17,438.55 levels. In less than ten points range, it has made three tops. Interestingly, during the last six trading sessions, the Nifty closed below the opening level, including Tuesday, and formed red candles. At the same time, the index is not closing below the prior day low. During the current uptrend, the Nifty consolidated for five to six sessions and then registered a breakout. The last five days, consolidation it is trading in just 184 points range. Still, it is above all short-term averages and not given any weaker signal. We expected this consolidation phase at the earliest.
Let us wait and watch whether this consolidation will extend beyond six days or register a breakout. In any case, the consolidation continues, it may test the 17,254 points. On a 75 minutes chart formed lower top and lower bottom bars, which shows a selling pressure at higher levels. It also forms a double top kind of pattern. Even the MA ribbon is flattening on the hourly chart, which indicates limited upside. The daily histogram is showing a declined momentum. The MACD line is near the signal, and any move below the signal line will give short term weak signs. Consider the fresh long positions on Nifty only above 17438. As it has not given any bearish signal, apply neutral strategies in the derivatives segment.
(The author is financial journalist, technical analyst, family fund manager)

