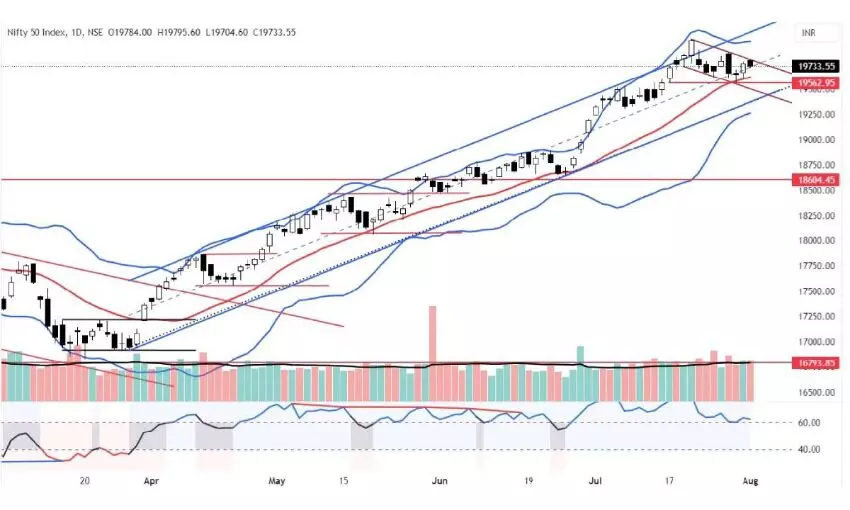
Charts indicate indecisiveness in mkt
MACD shows an increased bearish momentum; Nifty formed five long-legged Doji candles along with Hanging Man candle
image for illustrative purpose

The benchmark indices, once again traded in the range, closed negatively, with long unwinding. NSE Nifty declined by points 20.25 points or 0.10 per cent and closed at 19,733.55 points. The Nifty IT is the top gainer on Tuesday with 1.15 per cent. The Nifty IT and Pharma gained by just 0.15 per cent and 0.11 per cent, respectively. The Nifty Realty is the top loser with 1.52 per cent, and all other indices closed marginally negative. The India VIX has declined to 10.23 again, which is a historically lower level. The advance-decline ratio is positive at 1.63. About 229 stocks hit a new 52-week high, and 107 stocks traded in the upper circuit. HDFC Bank, IRFC, and ICICI Bank, NTPC were the top trading counters on Tuesday in terms of value.
The Nifty opened with a small positive gap, but was not sustained at the higher levels. It reacted at the sloping channel’s resistance line at least four times. It closed on the middle range of the rising channel drawn from the March low. The index has formed a hanging man candle. Volumes were lower than the previous day. The Elder’s impulse system has formed a fresh neutral bar. The RSI has been hovering around the 60 zones for the last seven days. The MACD line is further declined and shows an increased bearish momentum.
Even though the broader market breadth is positive, the Nifty breadth is negative. Only five sectors closed with gains. The Nifty has formed five long-legged Doji candles on an hourly chart, indicating the indecisiveness on the direction. It also failed to continue the previous day’s bullish momentum. For now, 19,760-800 points will act as a immediate resistance. Above this zone of resistance, the index can test the 19,870-900 zone. But in any case, if the index decline below Tuesday’s low of 19,704 points, it will once again test the 20DMA of 19,616 points. Now, the counter-trend consolidation is seven days old and may continue another one or two days at maximum. It has to break out of this consolidation for a directional move.
(The author is Chief Mentor, Indus School of Technical Analysis, Financial Journalist, Technical Analyst, Trainer and Family Fund Manager)

