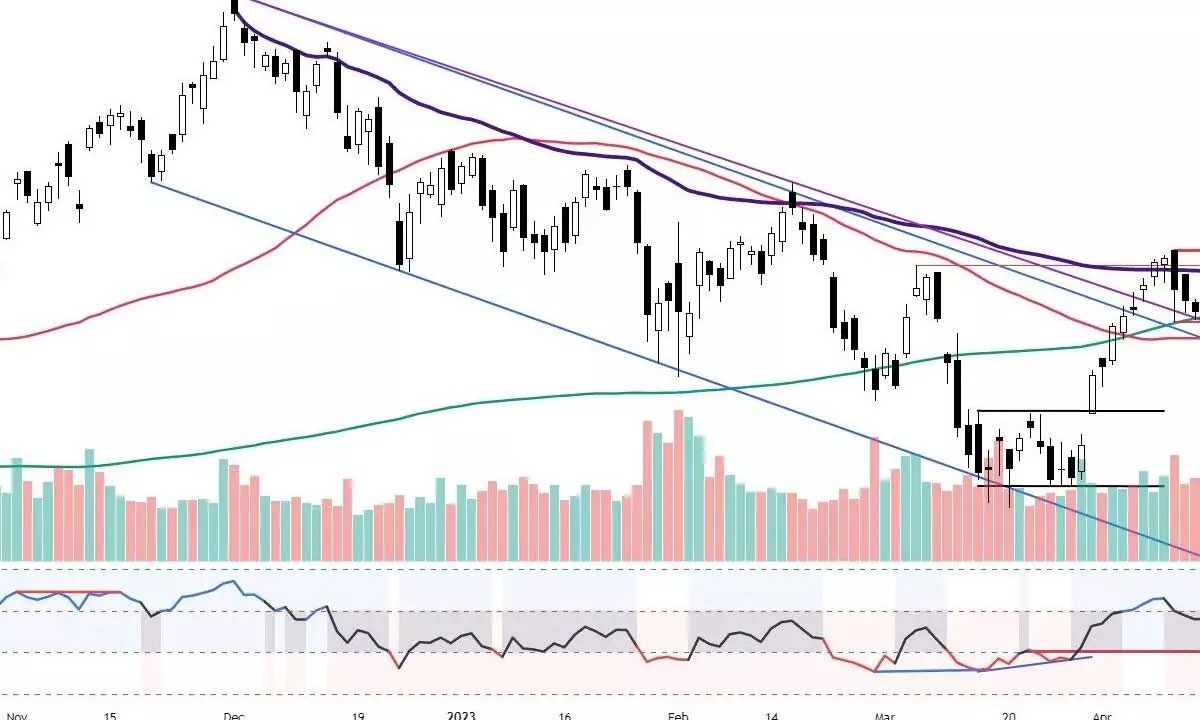
Charts indicate declining bullish momentum
The weekly and daily RSI is in the neutral zone; The daily RSI declined from a strong bullish zone and flattened for now; The weekly MACD is still bearish as it is below the signal line
image for illustrative purpose

The domestic equity market ended its three-week massive rally and took a breather by ending the last week modestly in the red. NSE Nifty declined by 203.95 points or 1.14 per cent. BSE Sensex is also down by 1.28 per cent. The Midcap-100 and Smallcap-100 indices outperformed the benchmark with 0.66 per cent and 0.34 per cent gains. Nifty PSU Bank and the FMCG indices were the top gainers with 2.1 per cent and 1.0 per cent gains. The Nifty IT was the top loser with 5.4 per cent. The advance-decline ratio was 1:1 during the last week. The FIIs renewed their selling pressure by exiting Rs3,914.05 crore in the previous week. The DIIs bought Rs3,125.27 crore worth of equities last week.
The index has formed a bearish engulfing candle on a weekly chart, which indicates an end of a massive swing of over a thousand points in just nine trading sessions. As we mentioned last week, the market formed an intermediate top on Monday, and the suspicion of exhaustion last week has turned into a reality. The minute after a positive gap opening, the Nifty declined sharply to the 200DMA support. Out of five days, it took support at 200DMA and closed negatively for four days. Interestingly, all five days, it took support at the sloping trendline drawn from 1st December, which acted as resistance earlier. Let’s watch for Friday’s low of 17,533.95 and the 200DMA of 17,605 for a directional view. In any case, the Nifty closes below this zone; the immediate support is at 50DMA, which is at 17,504 points. It means, for the near term, the 17,504-17,605 range will act as support.
The Nifty closed below the 23.6 per cent retracement level of the nine-day upswing. It traded mostly in the Monday range except for a few minutes on Friday. As it already broke the Monday range on the downside, it came out of an inside bar action, which is technically a breakdown. During the first two days of the week, the Nifty has formed open high candles, also called a bearish belt hold. Later three days of price action is just around the 100 points range. The pattern analysis shows that the Monday high of 17,863 is the intermediated top. Only above this level, the view will be negated. As mentioned above, if the Nifty closes below the Friday low of 17,553 points, we can consider that the previous week’s breakout is a failed one.
The weekly and daily RSI is in the neutral zone. The daily RSI declined from a strong bullish zone and flattened for now. The weekly MACD is still bearish, as it is below the signal line. The daily Histogram declined sharply, showing a decline in bullish momentum.
The volatility index, India VIX, is below 12 again and is at historic lows. We can interpret this low VIX, or fearless market, in three ways. First, the traders are complacent. Second, it can be the calm before the storm. Third, the market is giving a final chance to book profits, which the traders are ignoring. The low VIX levels generally signal a potential reversal or a correction is on the cards. This is the reason whenever the VIX hits lower levels, and traders must be cautious and vigilant and prepare for possible changes in the market direction.
The heavyweight index stocks are lined up for earnings next week. Any disappointments will dampen the sentiments. Focus on only high-conviction stocks with better earnings growth and relative strength stocks. Some of the pharma and FMCG sector stocks are showing improvement in relative strength and momentum.
(The author is Chief Mentor, Indus School of Technical Analysis, Financial Journalist, Technical Analyst, Trainer and Family Fund Manager)

