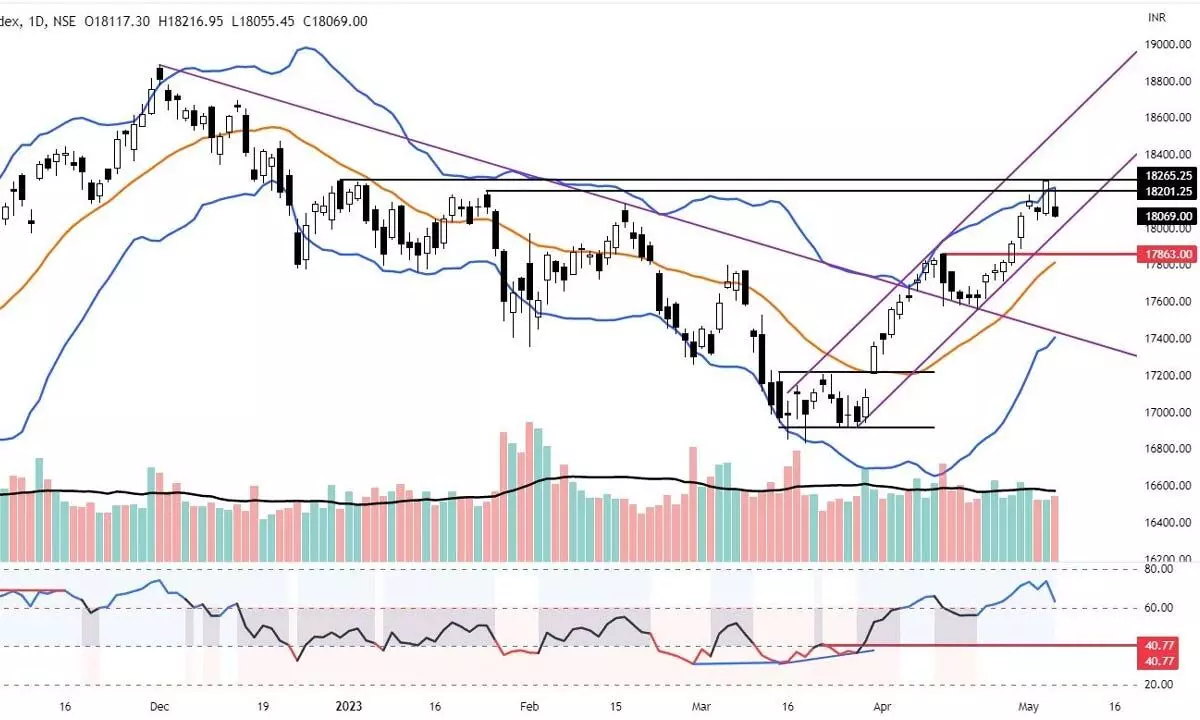
Charts indicate caution alert
Investors need to be alert as market closed below previous day’s low; On hourly chart, Wednesday’s negative divergence in RSI got the confirmation for its bearish implications as it closed below the prior swing low; Further, volume declined on a weekly basis
image for illustrative purpose

The domestic market erased all the gains of last three days. NSE Nifty declined by 188.05 points or 1.03 per cent and settled at 18,072.55 points. Nifty Auto, Infra, and FMCG indices closed positive with less than 0.40 per cent gains. Bank Nifty and FinNifty stocks dragged the market with 2.32 per cent and 2.137 per cent declines, respectively. The Media index is down by 1.75 per cent. All other sectoral indices are down by half a per cent on average. The India VIX is up by 5.45 per cent and settled at 12.37. The broader market index, the Nifty 500, declined by 0.83 per cent. The advances outnumber the declines, as the ratio is at 0.61. About 85 stocks hit a new 52-week high, and 63 stocks traded in the upper circuit. HDFC twins, ICICI Bank, and Axis Bank were the top trading counters today in terms of value.
The Nifty erased all its previous day’s gains and closed below the previous day's low. It has formed an inside bar and a shooting star candle on daily and weekly charts. The Nifty has registered a distribution day after many days. As we suspected in our previous columns, the market is showing exhaustion. A Shooting Star Doji on a weekly time frame is not a good sign. It also closed below the weekly opening level, which is also a negative factor. It has come back to the neutral zone from an extremely overbought zone. The HDFC twins, over five per cent, is the major reason for today's decline.
Overall, the profit booking happened across the sectors. On an hourly chart, yesterday’s negative divergence in RSI has got the confirmation for its bearish implications, as it closed below the prior swing low. The volume declined on a weekly basis, even if we consider four-day week. For the last three days, volumes have been consistently declining. The MACD line is flattened, and the histogram shows a decline in momentum. The Bank Nifty also formed a bearish candle - Dark Cloud cover on a weekly chart and a big negative bar on a daily chart. The last hour's selling pressure in the broader shows the intensified profit booking. Overall, the market structure has changed to cautious. Only in case of a move above the Thursday high will it be positive. On the downside, a reasonable correction is due. It may retrace at least 38.2 per cent retracement level of the current swing is 17,994 points. Below this, the 20DMA support is at 17812. We need to watch the market behaviour at this support zone. For, now take out the profits on the table.
(The Author is Chief Mentor, Indus School of Technical AnalysisFinancial Journalist, Technical Analyst, Trainer, Family Fund Manager)

