Household survey reflects general prosperity but concerns remain
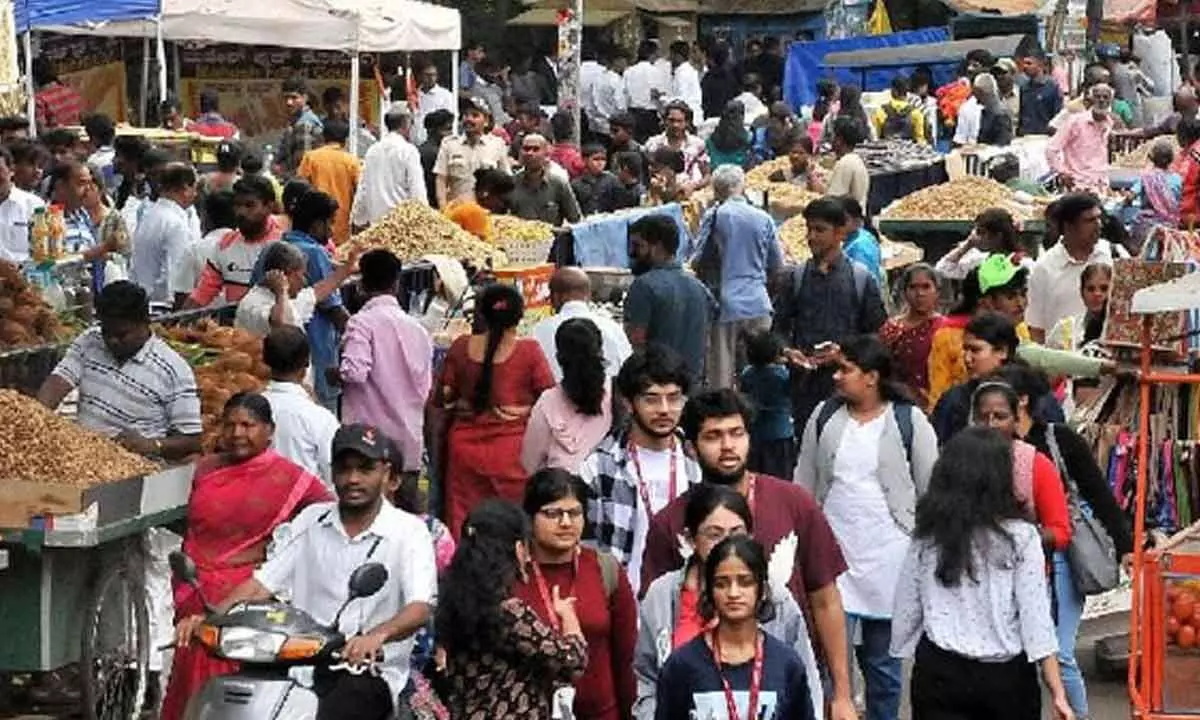
image for illustrative purpose

The government’s decision to release the fact-sheet of the Household Consumption Expenditure Survey (HCES) is a welcome step. The survey not only provides critical insights into the spending patterns of households but also informs decision makers about the broader economic trends. This helps them in strengthening the policy framework vis-à-vis calculating inflation. While providing vital datasets to comprehend the economic dynamics in the country, the HCES has underlined the fact that prosperity has generally increased, though there are major problems like rising inequalities. Despite a long gap since the survey in 2011-2012, one should remember that it is better late than never. The survey, conducted from August 2022 to July 2023, was aimed at generating estimates of household monthly per capita consumption expenditure (MPCE) and its distribution for the rural and urban sectors. MPCE estimates are based on the data collected from 261,746 households, of which 155,014 were in rural areas.
The consumption basket of items was divided into three broad categories: food items, consumables and services items, and durable goods. As a result, three separate questionnaires were designed and canvassed in the selected households in three separate monthly visits in a quarter.
The average MPCE of both urban and rural households rose more than two times between 2011-12 and 2022-23. In the case of rural households, it increased to Rs. 3,773 in HCES 2022-23 from Rs. 1,430 in 2011-12. This did not include values of items provided freely through various social welfare programmes. Similarly, the MPCE for urban households went up to Rs. 6,459 in 2022-23 from Rs. 2,630 in the previous HCES round. This also meant that the gap between rural and urban MPCEs slid from 83.9 per cent to 71.2 per cent. Two more data points indicate overall improvement: the percentage of spending on food in total expenditure and the percentage of cereals in MPCE. The results have been good on both counts. The share of food in MPCE came down from 56.98 per cent in 2009-10 to 52.9 per cent in 2011-12 to 45.38 per cent in 2022-23. The share of cereals in MPCE was 13.77 per cent, 10.75 per cent, and 4.91 per cent, respectively, in that period.
A few other trends can also be clearly seen from HCES. For instance, the southern states have uniformly done better than northern states, with the MPCE in both rural and urban categories being more than the national average. Then there is the issue of economic disparities. The bottom five per cent of rural population has an average MPCE of Rs. 1,441, whereas it is Rs. 2,087 in urban areas for the bottom five per cent. The corresponding figures for the top five per cent are Rs. 10,581 and Rs. 20,846, respectively. Inequalities have also been reported by other sources. Knight Frank’s ‘The Wealth Report 2024’ says that the number of India’s ultra-high-net-worth individuals’ (UHNWIs) is expected to increase to 19,908 by 2028 from 13,263 in 2023, a 50.1 per cent growth, the highest growth in the number of UHNWIs for any country in the next five years. It’s good, but there is no projection suggesting a similar development for the poor. Policy makers need to address this critical issue on a priority.

